Posts

How much should a tech repair shop charge for labor? Your tech repair shop labor rate is a math problem, not a market guess. Add monthly fixed costs to your technician's loaded cost, divide by the hours that actually land on tickets, then add the margin the shop needs. That is your floor, and the shop down the street does not know it. Part 3 of the nine-part Fix the Shop First series, with a free calculator.

Fix the Shop First · Part 3 of 9

By Rob Link, Founder & CEO, Tech Care Association · September 23, 2026 · 20 min read

What's in this post

  1. Key takeaways
  2. The short answer: how to calculate a tech repair shop labor rate
  3. What shops are saying
  4. Why the shop down the street is the wrong input for your labor rate
  5. Input 1: What does the shop cost to open every month?
  6. Input 2: What does an hour of technician actually cost?
  7. Input 3: How many hours actually land on a ticket?
  8. Input 4: What margin does the shop need?
  9. The floor rate, worked: a repair shop hourly rate from four inputs
  10. The Repair Labor Rate Calculator
  11. When the ceiling is below the floor
  12. From rate to price: how to price repair labor
  13. The TCA's Take
  14. What to do Monday morning
  15. The floor is yours. The presentation is where you compete.
  16. Quick summary
  17. Common questions about repair labor rates

Key takeaways

  • The floor rate comes from four inputs the shop already has after Part 2: fixed costs, loaded technician cost, paid hours, and utilization.
  • Billable hours, not paid hours, are the denominator. This is where most rates go wrong.
  • Margin is added on top of the floor, not hoped for underneath it.
  • When a competitor caps your price below your floor, the options are overhead, utilization, service mix, or exit, and the calculator shows which.
  • The rate is one number. How it is presented (flat, per repair, tiered, minimum) is a separate decision, covered briefly here and in Part 4 next week.

The short answer: how to calculate a tech repair shop labor rate

Direct answer
Your labor rate is a math problem, not a market guess. Add your monthly fixed costs to your technician's loaded cost, divide by the hours that actually land on tickets, then add the margin the shop needs. That is your floor. The shop down the street does not know your overhead. If their price is below your floor, you have a cost problem or a mix problem, not a pricing problem.

The TCA Labor Rate Formula
Floor rate = (monthly fixed costs + loaded technician cost) / billable hours / (1 - target margin)

The labor rate formula as a flow Fixed costs of $9,000 plus loaded technician cost of $3,600 equals $12,600 a month to cover. Divided by 88 billable hours gives a break-even rate of $143.18. Divided by one minus a 20 percent target margin gives a floor rate of $178.98 per billable hour. Illustrative numbers. Four inputs in, one floor out Monthly fixed costs $9,000 + Loaded technician cost $3,600 = Monthly cost to cover $12,600 / Billable hours 88 160 paid hours x 55% utilization Break-even rate $143.18 / 1 minus target margin 1 - 0.20 = 0.80 = FLOOR RATE $178.98 per billable hour Illustrative example carried over from Part 2. Not a benchmark. The TCA has not published a labor-rate benchmark. Source: Tech Care Association.
The formula as a flow. Fixed costs and loaded labor go in, billable hours divide, margin is added, the floor comes out.

What shops are saying

Observational evidence from TCA Repair Community Listening. Method and limits are in the footer.

In the online discussions the TCA reviewed over two weeks, repair professionals stated their labor prices freely and argued about them constantly. Not one described how the number was built. Shops know their price. Almost none described knowing their rate.

In one discussion of flat screen labor, stated floors clustered between $85 and $100, with a low of $40 from the only shop in a small town and a high of $150 or more. The structures varied: a $100 minimum that drops to $60 when the job turns out quick, a flat amount plus a multiple of the part cost, a list price with a capped coupon. Two participants said the chain store in the next town caps what they can charge; one said he cannot go above $85. Another has held the same price for two years.

The sharpest split came over a liquid-damaged console. Several participants priced from the device's replacement value, on the reasoning that customers will pay a certain amount to fix anything that costs $600 to replace. One argued the device's value is irrelevant and that hours times rate, plus parts, is the only honest method. Stated prices for that one job ran from $50 to $299.

The community is arguing value against cost without a shared vocabulary for either. This chapter supplies the cost half.

Why the shop down the street is the wrong input for your labor rate

When you copy a competitor's price, you copy one number and none of the things that produced it. You do not get their rent. You do not get their payroll, their loan balance, or whether the owner takes a paycheck. You do not get their utilization, which Part 2 defined as the share of paid bench time that lands on a ticket. You do not get their mix, and a shop living on short, repeatable jobs has different economics from a shop doing board work.

You also do not know if their price works. Why Tech Repair Shops Fail laid out the closure record. Some of the prices you are matching belong to shops that will not be open next year. In the discussions the TCA reviewed, undercutting stories were common: a competitor at $75 for a current flagship screen, another at $19.99. No participant described actually losing a customer to one.

The TCA has to own a piece of this. In 2025 the TCA published Simplifying Your Tech Repair Shop Pricing, which set the minimum hourly rate as monthly expenses divided by available work hours, and described $60 to $100 an hour as an industry standard. This chapter supersedes both points. Available hours is the wrong divisor, for reasons input 3 makes plain. And the TCA has no source for that range that meets its current evidence standard, so it is withdrawn. It takes four inputs to find the rate that is right for your shop.

There is no correct national labor rate. There is a correct labor rate for your shop.

Input 1: What does the shop cost to open every month?

Monthly fixed costs, excluding bench technician pay.

This is the denominator of Part 2's number five, months of cash reserve, used again. Pull the last three months of bank statements and average them: rent, utilities, software and POS, insurance, phones and internet, loan payments, marketing you are committed to, counter or admin payroll.

One adjustment from Part 2. Part 2's fixed cost list included base payroll. For this formula, take bench technician pay out of the fixed cost number, because it goes in as its own input next. Count it once.

What shops are saying. One participant put combined housing and shop lease costs above $6,000 a month beside an $80 labor charge and observed that it only works at one repair every ten minutes. That is input 1 meeting the price with nothing in between. The rest of this chapter is the in between.

Input 2: What does an hour of technician actually cost?

Loaded technician cost = wages x (1 + employer taxes and benefits percentage).

A technician paid $20 an hour does not cost the shop $20 an hour. The employer's share of Social Security and Medicare is 7.65 percent of wages by federal statute. State and federal unemployment insurance and workers' compensation come on top and vary by state and by your claims history. Paid time off, if you offer it, is a wage you pay for an hour nobody works. Your payroll provider can give you the real percentage in one phone call.

What the federal data says. There is no federal wage category for an independent phone, tablet, and computer repair technician. The closest occupation in the Bureau of Labor Statistics Occupational Employment and Wage Statistics program is Computer, Automated Teller, and Office Machine Repairers (SOC 49-2011). According to the Bureau of Labor Statistics May 2025 estimates, released May 15, 2026, the national median wage for Computer, Automated Teller, and Office Machine Repairers (SOC 49-2011) was $22.99 an hour, or $47,810 a year. Read it for what it is: the closest federal occupation, not a repair-industry wage survey. It includes ATM and copier field technicians, and it excludes the self-employed, which leaves out a large share of this industry.

On the gap between wage and cost, the BLS Employer Costs for Employee Compensation release for June 2026, published September 9, 2026, put average private industry compensation at $46.89 per hour worked, with wages at 70.0 percent and benefits at 30.0 percent. That is all private industry, not repair, and a small shop with no health plan or retirement match will run well under 30. The part that does not go away is the legally required piece. For full-time private industry workers it averaged $3.76 an hour against $36.97 in wages, or about 10 cents on every wage dollar. At the $22.99 median, that alone puts the loaded hour above $25 before a single paid day off.

What shops are saying. In a discussion of roughly 40 comments about technician pay, stated hourly pay clustered at $15 to $20 for entry technicians and $20 to $25 for experienced ones, with commission or tips commonly added. One skill-tiered scale ran $15 for screens and modular work, $20 for soldering and refurbishing, and $25 for technicians who also handle unlocks. These are figures participants stated, not a wage benchmark. They sit close to the federal median, and they are wages, not costs.

If you are the only technician. Several participants across the discussions said they do not pay themselves or have no employees. No participant described putting a value on the owner's own bench hour. Use the on-paper rate from Part 2: what you would have to pay someone else to do your bench work. Enter zero and the formula hands you a rate that only works as long as you work for free.

Input 3: How many hours actually land on a ticket?

Billable hours = paid technician hours x labor utilization.

You pay for every hour a technician is in the building. You only get paid for the hours that land on a ticket.

This is Part 2's number three, and it is the input everyone skips. A full-time technician is paid for roughly 2,080 hours a year. The shop cannot sell 2,080 hours. Technicians answer the phone, check customers in, look up parts, wait on deliveries, clean the bench, redo the occasional job, handle warranty returns, and talk to the customer who wanted twenty minutes. All of it is paid. None of it lands on a ticket.

Look at what utilization does to the cost of labor alone, before a dollar of rent. Take the worked example's loaded technician cost of $22.50 an hour (illustrative):

UtilizationTechnician cost per billable hour
100 percent$22.50
75 percent$30.00
55 percent$40.91
50 percent$45.00

Illustrative arithmetic, not a benchmark. The TCA has no sourced industry range for repair shop utilization. Measure yours.

Same technician, same paycheck. The cost of a sold hour doubles between a full bench and a half-full one. Now do the same thing with the rent.

Why dividing by paid hours produces a rate that loses money. Divide the month's costs by paid hours and you get a rate that assumes every paid minute is sold. It never is. Charge that rate for the hours you actually sell and the unsold hours come straight out of the owner's pocket. The worked example below shows the size of it.

What shops are saying. Shops already hold the data for this input without using it. One participant described screens on four recent phone generations at $120 to $170 in labor and about 20 minutes of bench time. Arithmetic on that one participant's stated numbers implies $360 to $510 per bench hour on that job. It is not a benchmark, and most participants had never framed it that way. Short, repeatable jobs were described as easy money, not as a rate. A separate discussion of technician metrics showed the target state already exists in the community: owners there named rework rate, net hourly productivity, and a direct labor efficiency ratio. One added a fair caution, that the best technicians spend unbillable time cleaning up other people's failures, which no ratio captures.

Input 4: What margin does the shop need?

Rate with margin = break-even rate / (1 - target margin).

Break-even is not a business plan. A shop that exactly covers its costs has nothing for the cash reserve from Part 2, nothing for the tool that breaks, nothing for the slow month, and nothing for growth. Margin goes on top of the floor, not hoped for underneath it.

The arithmetic trips people up. To keep 20 percent of every dollar, you do not add 20 percent to your cost. You divide by 0.80. A $100 cost with 20 percent added is $120, and $20 of $120 is 16.7 percent, not 20. Divide $100 by 0.80 and you get $125, and $25 of $125 is 20 percent.

Setting a target: the TCA set targets in Part 2 the same way it sets this one. It is your own. There is no sourced operating margin benchmark for independent tech repair, and the TCA will not invent one. Start from what the shop has to fund in the next twelve months: the reserve target you named in Part 2, equipment, debt paydown, a raise for your lead technician. Turn that into a percentage of labor revenue. The 20 percent used below is illustrative.

The floor rate, worked: a repair shop hourly rate from four inputs

Floor rate = (monthly fixed costs + loaded technician cost) / billable hours / (1 - target margin).

A worked example (illustrative numbers carried over from Part 2, not a benchmark). One technician, paid for 160 hours in the month. Direct technician labor of $3,600, which was $30 a ticket across Part 2's 120 tickets and is $22.50 per paid hour here: a $20.00 wage plus 12.5 percent in employer taxes. Utilization of 55 percent, so 88 billable hours. Fixed costs of $9,000 a month, which in this example covers rent, utilities, software, insurance, a loan payment, and counter payroll, but not the technician. Target margin of 20 percent.

  1. Monthly cost to cover: $9,000 + $3,600 = $12,600
  2. Billable hours: 160 x 55 percent = 88
  3. Break-even rate: $12,600 / 88 = $143.18 per billable hour
  4. Floor rate with margin: $143.18 / 0.80 = $178.98 per billable hour

Now the mistake. Divide the same $12,600 by 160 paid hours and you get $78.75. Add the same margin and you get $98.44. That looks like a sensible labor rate. Charged across the 88 hours the shop actually sells, it brings in $8,662 against $12,600 in costs, and the shop loses about $3,940 a month while the bench looks busy. In the TCA's illustrative example, the floor rate built on 88 billable hours ($178.98) is 82 percent higher than the rate built on 160 paid hours ($98.44), and the entire difference is labor utilization.

The paid-hours rate versus the floor rate Bar chart of three rates from the same $12,600 monthly cost. Dividing by 160 paid hours with a 20 percent margin gives $98.44, which loses about $3,940 a month. Dividing by 88 billable hours gives a break-even of $143.18 and a floor with margin of $178.98. Illustrative numbers. Same costs, same margin, two denominators Divided by 160 paid hours (the mistake) $98.44 loses about $3,940 a month Divided by 88 billable hours: break-even, no margin $143.18 Divided by 88 billable hours, with a 20 percent margin: the floor $178.98 Illustrative example: $9,000 fixed costs, $3,600 loaded technician cost, 55 percent utilization. Not a benchmark.
Paid hours and billable hours produce two very different rates from identical costs. Only one of them pays the rent.

What the floor is, and is not. The floor is what every billable hour has to bring in after the part is paid for, however the shop collects it: a labor line, a parts markup, a flat price, or some of each. It is not a command to print $178.98 on a rate sheet. To see where you stand, take last month's repair revenue, subtract parts cost, and divide by billable hours. That is what you collect per billable hour today.

Run that on Part 2's example shop. Revenue of $14,400 minus $5,200 in parts leaves $9,200. Across 88 billable hours that is $104.55. Break-even is $143.18. The gap, $38.63 an hour across 88 hours, is $3,400 a month, which is exactly what that shop is losing. Part 2 showed a gross margin of $46.67 per ticket and said it had to cover everything else. This is what "did not cover it" looks like as a rate.

If you post an hourly labor rate and earn parts margin separately, the calculator has an optional line to credit a conservative monthly parts gross profit. Run it without the credit first. Parts margin is real, and it is the subject of the October 7 chapter. It is a cushion, not a plan.

The Repair Labor Rate Calculator

Free, no signup, and nothing you type leaves the page. Enter last month's numbers. The math is shown line by line so you can check it.

The Repair Labor Rate Calculator

Enter last month's numbers. The math is shown line by line so you can check it. Nothing you type leaves this page.

Line 1: Fully loaded labor cost
Line 2: Total monthly cost your labor must cover
Line 3: After the parts gross profit credit
Line 4: Required labor revenue at your target margin
Your labor rate floor

The floor is what last month's numbers say you need per billed hour before your target margin means anything. If your market ceiling sits below this floor, the math has not failed. It has told you something nobody else will.

Open the calculator in its own tab

When the ceiling is below the floor

This is the objection from Part 2, and it is a fair one. Two participants said a chain store in the next town caps what they can charge. One cannot go above $85. If the math says your floor is above what your market will pay, the math has not failed. It has told you something nobody else will.

A ceiling below the floor leaves four levers. Each one points to a chapter in this Guide.

  1. Fixed costs. Renegotiate the lease, downsize the footprint, cancel software nobody opens, refinance the loan. In the worked example, taking fixed costs from $9,000 to $7,500 moves the floor from $178.98 to $157.67.
  2. Utilization. Part 2, number three. In the worked example, moving from 55 to 75 percent moves the floor to $131.25. Twenty points of utilization did more than $1,500 a month of rent. Both together bring it to $115.63.
  3. Service mix. The October 14 chapter covers what earns bench space. The highest implied hourly figures in the discussions the TCA reviewed came from short, repeatable jobs: charge port cleaning, which four participants named as the pure-labor ticket, a console port repair named most often as the ideal repeat job. If the capped repair cannot clear your floor, the question is how much of your bench it should occupy.
  4. Exit the category. If a repair cannot clear the floor after the first three levers, stop offering it, or offer it only as a way to fill hours that would otherwise sell for nothing, knowing that is what you are doing. Part 2 said the same of program work: a filler, not a foundation.

"Match the chain" is the one option that is never on the list. The chain has a different rent, a different parts contract, a different payroll, and a parent company. You are not matching their price.

Matching the chain means adopting their price with your costs.

Four levers when the ceiling is below the floor Bar chart of the worked example's floor rate under different levers. Today $178.98. Fixed costs cut to $7,500: $157.67. Utilization raised to 75 percent: $131.25. Both: $115.63. A dashed line marks the $85 ceiling one participant described. When cost levers are not enough, the remaining levers are service mix and exiting the category. Illustrative numbers. Which lever moves the floor $85 ceiling one participant described Today $178.98 Lever 1: fixed costs from $9,000 to $7,500 $157.67 Lever 2: utilization from 55 to 75 percent $131.25 Levers 1 and 2 together $115.63 Still above the ceiling? Lever 3 is service mix. Lever 4 is exiting the category. "Match the chain" is never on the list. Illustrative example, 20 percent target margin. The $85 figure is one participant's stated ceiling, not a market rate.
The calculator shows which lever matters most for your shop. In this example, utilization moves the floor more than rent does.

From rate to price: how to price repair labor

The customer never sees your hourly floor. They see a price. Getting from one to the other is a presentation choice, and every structure described in the discussions the TCA reviewed can sit on top of the same floor.

Per-repair pricing. Estimate ticket time by repair type, multiply by the floor, add the part. Ticket time is not bench time. A 20-minute screen still has intake, inspection, a ticket to write, testing, reassembly checks, a call to the customer, and checkout. If that adds 15 minutes, it is a 35-minute ticket. At the illustrative floor, that is about $104 after the part. One shop in the discussions quotes a 45-minute turnaround on screens; at the illustrative floor a 45-minute ticket is about $134. Time ten of your own before you trust either number.

A minimum charge. Every ticket carries the same intake and checkout no matter how short the repair. A minimum protects the floor on small jobs. The participant with a $100 minimum that drops to $60 on quick jobs is running this logic already. What the floor adds is a way to check whether $60 still clears it.

Tiers. Part 2's listening found one shop with three tiers on a single model, roughly $65, $95, and $145, separated by warranty and turnaround. Tiers are presentation. The test is whether the bottom tier clears the floor after the part. If it does not, it is not a budget option. It is a subsidy.

Difficulty surcharges. Shops that do board work described base-plus pricing: a base plus an amount per torn pad after a failed DIY attempt, or a regular price plus an amount per ripped trace. The reasoning participants gave is exactly right: extra time costs money because it displaces other billable work. That is the floor rate, stated in an owner's words.

Effective labor rate, the monthly check. The posted rate is a promise. The effective rate is what happened: repair revenue minus parts cost, divided by billable hours. Discounts, bundles, warranty redos, and underbilled jobs all leak out between the two. Put the effective rate beside the floor every month. It is the sixth number, and it belongs on the same sheet as Part 2's five.

Two things are deliberately short here. Whether to charge for diagnosis, and how much, is next week's chapter. Parts markup is October 7.

The TCA's Take

This section is the TCA's position, not a finding from the community evidence above.

A shop that prices below its floor is paying customers to come in. The TCA's position is that the floor is non-negotiable and the presentation is where the creativity goes. Flat, tiered, hourly, minimum, surcharge: all fine, on top of the floor. None of them fine underneath it.

Every objection the TCA heard this week has the same answer.

"The chain in the next town caps my price." Then you know your ceiling, and the only open question is your floor. If the floor is under the ceiling, you have room and did not know it. If it is over, you have four levers, and matching is not one of them.

"Customers will pay $175 to $200 to fix anything on a $600 console." Maybe so. Value-based pricing is a fine way to decide how far above the floor to go. Without a cost-based floor underneath, it is a guess with a rationale attached. Know the floor first, then charge what the repair is worth.

"The device's value is irrelevant. Hours times rate plus parts." Half right, and the better half. But only if the rate was built and not borrowed. An hourly method running on someone else's number is still a guess.

"There's a guy doing it for $19.99." There always is. You do not know his costs, whether he pays himself, or whether he will be open in a year. His price is information about him.

"I've held my price for two years." Your landlord, your parts supplier, and your payroll provider did not hold theirs. A price held against rising costs is a pay cut you gave yourself quietly.

"I'm solo. I don't pay myself." Then your rate is subsidized by the most skilled technician in the building working for free. Put a number on your hour and run the formula again.

"Those quick jobs are easy money." They are your best rate, and you should know it as a rate. That is the first fact you need for the service mix chapter.

The discussions showed that some owners already run labor as a ratio. The target state is not theoretical. It is in the community today, and it is four inputs away for everyone else.

What to do Monday morning

  1. Run the calculator with last month's numbers. Fixed costs without technician pay, technician wages, your employer tax percentage, paid hours, utilization, and a target margin. If you did not measure utilization after Part 2, use the 55 percent placeholder, then go measure it. Do not chase precision on the first pass. Chase completion.
  2. Find what you collect per billable hour today. Last month's repair revenue, minus parts cost, divided by billable hours. Put it beside the floor. Write the gap down, in dollars per hour and dollars per month.
  3. Time your next ten tickets of your most common repair, door to door. Intake to checkout, not just bench time. Divide what you collected after the part by the minutes. Compare it to the floor. That one number tells you whether your most common job is carrying the shop or being carried by it.

The floor is yours. The presentation is where you compete.

Every owner in the discussions the TCA reviewed could state a price. Not one described how it was built. The build is four inputs you already have, one division most shops get wrong, and one more for margin. After that, the number is yours. It does not move because someone across town ran a coupon. It moves when your rent, your payroll, or your utilization moves, and you will be the first to know.

Next Wednesday, September 30, the series turns to the diagnostic fee: whether to charge one, how much, and when to credit it. A technician is not worth zero dollars an hour because they are finding the fault instead of installing the part. Bring your floor rate. You will need it.

Start here. Free, no signup.

Run the Repair Labor Rate Calculator

How healthy is your shop, really?

TCA ShopCheck is a free two-minute health check built for independent repair shops. Your Run It Well score is the fast read on how the operational side is functioning. This chapter and the calculator are the detail behind the pricing part of it.

Run TCA ShopCheck Free

Quick summary

  • A tech repair shop labor rate is calculated, not copied. Floor rate = (monthly fixed costs + loaded technician cost) / billable hours / (1 - target margin).
  • Loaded technician cost is wages plus employer taxes and benefits. The employer share of Social Security and Medicare alone is 7.65 percent of wages.
  • Billable hours are paid hours multiplied by labor utilization. Dividing costs by paid hours produces a rate that loses money on every unsold hour.
  • Margin is added by dividing by (1 minus the target), not by adding a percentage on top.
  • Federal wage anchor: $22.99 an hour median for SOC 49-2011, the closest federal occupation to a repair technician (BLS OEWS, May 2025, released May 15, 2026). It is a wage, not a cost and not a rate.
  • If a competitor caps your price below your floor, the four levers are fixed costs, utilization, service mix, and exiting the category. Matching is not one of them.
  • The TCA has published no labor-rate benchmark and withdraws the $60 to $100 range from its 2025 pricing article.

Common questions about repair labor rates

How do I calculate a labor rate for a tech repair shop?

Add monthly fixed costs to your loaded technician cost (wages plus employer taxes and benefits). Divide by billable hours, which is paid technician hours multiplied by utilization. That is your break-even rate. Divide it by one minus your target margin to get the floor rate. The TCA's free Repair Labor Rate Calculator does the arithmetic and shows each step.

What is a good hourly labor rate for a phone or computer repair shop?

The TCA has not published a labor-rate benchmark and does not recommend using one from an unsourced list, including the $60 to $100 range the TCA itself cited in 2025, which is withdrawn. Two shops with different rent, payroll, and utilization need different rates. Calculate your own floor. It is the only rate that is right for your shop.

Why use billable hours instead of paid hours?

Because you only get paid for the hours that land on a ticket. Dividing costs by paid hours assumes every paid minute is sold, which never happens. In the TCA's illustrative example, 88 billable hours out of 160 paid produces a floor rate 82 percent higher than the paid-hours rate, and charging the lower number loses about $3,940 a month.

Should I match a competitor's or a chain store's repair price?

No. A competitor's price tells you nothing about their rent, payroll, utilization, or whether the price even works for them. If a competitor caps your price below your floor, the options are lower fixed costs, higher utilization, a different service mix, or leaving that repair category. Matching is not on the list.

I am a solo owner with no payroll. What do I enter for technician cost?

Enter what you would have to pay someone else to do your bench work, plus employer taxes. If you enter zero, the formula produces a rate that only works while you work for free, and it will break the day you hire.

Should a repair shop charge hourly or flat rate?

Either works. The floor is an hourly figure, but customers can see it as a flat price per repair, a minimum charge, or tiers by warranty and turnaround. Multiply the floor by realistic ticket time, including intake, testing, and checkout, then add the part. Check monthly that your effective rate, repair revenue minus parts cost divided by billable hours, stays above the floor.

More from the TCA Blog

Rob Link is the founder of the TCA. He built and ran a multi-location repair chain in an earlier era of this industry, and he'd tell you today's operators have it harder. The TCA is independent of carriers, manufacturers, and insurance companies, which is exactly why it can tell shop owners the truth about growth.

Sources and methodology

  • Technician wage: U.S. Bureau of Labor Statistics, Occupational Employment and Wage Statistics, May 2025 estimates, released May 15, 2026 (USDL-26-0725). Occupation: Computer, Automated Teller, and Office Machine Repairers, SOC 49-2011. National median $22.99 hourly, $47,810 annual. This is the closest federal occupation to an independent repair technician, not a repair-industry wage survey. OEWS estimates exclude the self-employed. Confirmed September 19, 2026.
  • Employer compensation costs: U.S. Bureau of Labor Statistics, Employer Costs for Employee Compensation, June 2026, released September 9, 2026. Private industry: $46.89 total compensation per hour worked; wages and salaries 70.0 percent, benefits 30.0 percent. Full-time private industry workers: wages $36.97, legally required benefits $3.76. The "about 10 cents on every wage dollar" figure is the TCA's arithmetic on those two numbers. All private industry, not repair specific.
  • Employer share of Social Security and Medicare (7.65 percent): federal statutory rate under the Federal Insurance Contributions Act.
  • Earlier pricing guidance from the TCA: Simplifying Your Tech Repair Shop Pricing, April 2, 2025. This chapter supersedes its hourly rate formula and withdraws its $60 to $100 range.
  • Worked examples in this chapter use illustrative numbers carried over from Part 2 to show the formula. They are not industry benchmarks, and the TCA has not published a benchmark for labor rate, utilization, or operating margin.
  • Stated prices, times, and pay figures from Community Listening are reported as participants stated them. Arithmetic on stated figures is labeled where it appears.

About this data: The TCA reviewed approximately 230 comments from repair professionals across 12 online industry discussions about repair pricing between September 9 and 19, 2026. These discussions were voluntary and were not collected through a representative survey. Findings describe the comments reviewed and should not be interpreted as estimates for the entire repair industry. Comments from parts vendors and service resellers were excluded. Individual participants are not identified without permission.

Published September 23, 2026. Last updated September 23, 2026.
Revenue tells you the shop is busy. Five numbers tell you whether it survives: gross margin per ticket, average ticket, labor utilization, callback rate, and months of cash reserve. Most owners track none of them consistently. Each can be captured in under an hour a week, and together they show exactly where the shop is leaking money. Part [N] of the nine-part Fix the Shop First series.

Fix the Shop First · Part [N] of 9

Key takeaways

  • Busy and profitable are different things. Shops close with a full bench, and the closure record shows it.
  • Five numbers cover the whole picture: gross margin per ticket (finance), average ticket (pricing), labor utilization (capacity), callback rate (quality), and months of cash reserve (survival).
  • Each one has a one-line formula, and every input already exists in your point of sale, your payroll, or your bank statement.
  • Capture all five for last month as a baseline. Pick one to improve. Re-measure next month.
  • If you take insurance claims or third-party warranty work, run the five numbers for that channel on its own. Program jobs produce gross revenue; they do not always produce margin.
  • TCA ShopCheck gives you the same baseline in about two minutes. This chapter gives you the detail behind it.
The five numbers every tech repair shop must track A scorecard listing five metrics with their formulas: gross margin per ticket, average ticket, labor utilization, callback rate, and months of cash reserve. The five numbers one hour a week 1 Gross margin per ticket What you keep on each repair before overhead (revenue minus parts minus direct labor) / tickets Source: POS, invoices, payroll 2 Average ticket Watch the trend month to month, not the figure revenue / tickets Source: POS 3 Labor utilization Share of paid bench time that lands on a ticket billable hours / paid hours Source: POS, schedule or timeclock 4 Callback rate Count disputes too; they cost bench time either way warranty returns / completed repairs Source: POS, warranty ticket type 5 Months of cash reserve How long the shop runs if revenue stopped tomorrow cash on hand / average monthly fixed costs Source: bank statements
The five numbers, their formulas, and where each input already lives in your shop.

What shops are saying

Observational evidence from TCA Repair Community Listening. Method and limits are in the footer.

In the online discussions the TCA reviewed this week, repair professionals argued about price in nearly every thread: what to charge for labor, what to charge for a screen, what to pay a technician. Almost none discussed what the shop keeps after the repair. Across the discussions reviewed, one participant stated a margin figure. No participant mentioned reserves, runway, or months of expenses in the bank.

That is not a lack of interest. Price is the number on the receipt. Margin is the number nobody handed them.

The most contested topic was economy LCD screens versus OLED, which surfaced in four separate discussions in one week. One camp argued that installing economy screens damages a shop's reputation for a small one-time profit, and that the customer who "never comes back" went somewhere else. Another camp, including an owner who once sold OLED only, argued that customers choose the economy option when it is offered, that people who break phones break the next screen regardless, and that shops should stop running each other down. A third position, held by several, was that the choice is fine as long as the customer understands what they are buying.

Every side argued from anecdote. Nobody cited a warranty-return number. Hold that thought for number four.

Why "busy" is the most dangerous word in repair

Busy feels like safety. The phone rings, the bench is full, the deposit goes in every day. Then a shop that was full every day closes, and everyone who knew the owner says the same thing: they seemed to be doing fine.

The TCA has written about this twice. Why Tech Repair Shops Fail laid out the closure record. Bureau of Labor Statistics data, as analyzed by Commerce Institute in 2025, puts first-year failure for retail businesses at 15.8 percent and five-year failure at 41.7 percent. The TCA's own estimate for independent tech repair is worse: first-year failure close to 30 percent, nearly double the retail figure, and an annual failure-or-exit rate of 30 to 40 percent. That article also listed what survivors do differently, and one habit on the list was tracking their numbers. This chapter is the how.

First-year business failure rates compared Bar chart. Retail businesses 15.8 percent, all U.S. industries 20.4 percent, both from Bureau of Labor Statistics data via Commerce Institute. Independent tech repair close to 30 percent, a TCA estimate. Share of businesses that fail in their first year Retail businesses 15.8% All U.S. industries 20.4% Independent tech repair close to 30% (TCA estimate) Sources: U.S. Bureau of Labor Statistics data via Commerce Institute (2025) for retail and all industries; Tech Care Association internal research (2026) for independent tech repair. Bars are to scale.
Tech repair's first-year failure rate, by the TCA's estimate, runs nearly double the retail figure.

Nobody knows the exact number of independent tech repair shops in the U.S. The TCA works from roughly 40,000, give or take. At a 30 percent annual exit rate, that is more than 10,000 shops closing every year, and as Why Tech Repair Shops Fail put it, "The industry is running a 100% replacement rate. Every year. Just to stay flat."

The Data Gap explained the cost of running a shop on numbers you do not have. The TCA's estimate there was that the average independent shop leaves $50,000 to $75,000 on the table every year through pricing errors, dead inventory, missed repeat business, and supplier problems it never measured. You cannot fix pricing you never measured.

The wider small business data says the same thing in a different accent. Across all U.S. industries, Bureau of Labor Statistics data puts first-year business failure at 20.4 percent and five-year failure at 49.4 percent. In a February 2026 Bluevine survey of 785 small business owners, 56 percent said they hit significant cash flow problems within their first three years, 26 percent said financial tasks take more time than they expected, and bookkeeping was the biggest weekly time drain for 42 percent. And when CB Insights analyzed 431 venture-backed startups that shut down since 2023, 70 percent had run out of capital, but the report's own conclusion was that running out of money is where the story ends, not why it ends. Unsustainable unit economics, meaning the business cost more per customer than it earned, showed up in 19 percent of those post-mortems. Those were funded startups, not repair shops. The lesson transfers anyway: the bank balance is the symptom. The five numbers are the diagnosis.

The community discussions this week put faces on all of it.

One participant described holding the same labor price for two years, considering an increase, and summed up his shop as not high-volume but consistently busy. Busy but flat, in one sentence.

Another participant, in a discussion about whether $80 is too little to charge for a screen replacement, put his overhead beside that figure. With combined housing and shop lease costs above $6,000 a month, he observed, $80 labor only works if the shop turns a repair every ten minutes. That is the whole chapter in one comment. The price is not wrong on its own. The price is wrong for that shop, at that overhead, at that throughput. You cannot know which one you are until you do the math.

A third participant, replying to a thread full of stated labor prices, asked in effect whether anyone was getting paid at all. It was a joke. It got a lot of agreement.

And two participants said the chain store in the next town caps what they can charge. One said he cannot go above $85. When the ceiling is set from outside, the only thing left to control is the floor, and the floor is set from inside. That is what the five numbers are for.

Number 1: What am I actually keeping on each repair?

Gross margin per ticket = (ticket revenue minus parts cost minus direct labor cost) divided by number of tickets.

This is the number that separates a busy shop from a profitable one. Revenue is what the customer paid. Gross margin is what was left after you paid for the part and paid the person who installed it, before rent, software, insurance, and everything else that keeps the lights on.

Where each input lives:

  • Ticket revenue: your point of sale. Total repair revenue for the month, excluding retail and accessory sales if you can separate them. If you cannot, note it and be consistent every month.
  • Parts cost: your supplier invoices or your POS if it tracks cost of goods. Use what you actually paid, including shipping.
  • Direct labor cost: payroll for technician hours only, at their loaded rate (wages plus employer taxes). If you are the technician, pay yourself a rate on paper for this line, or the number lies to you.
  • Tickets: your POS count of completed repair tickets.

A worked example (illustrative numbers, not a benchmark): a shop closes 120 repair tickets in a month for $14,400 in repair revenue, spends $5,200 on parts and $3,600 on direct technician labor. Gross margin is $5,600, or $46.67 per ticket. That $46.67 has to cover every other cost in the shop before there is a dollar of profit.

Where an average $120 ticket goes in the worked example A single bar for a $120 average ticket split into parts $43.33, direct labor $30.00, and gross margin $46.67 per ticket. Illustrative numbers. One average ticket in the worked example: $120.00 Parts $43.33 Labor $30.00 Gross margin $46.67 The $46.67 has to cover rent, software, insurance, loan payments, and your own pay before there is a dollar of profit. At a 3.3 percent callback rate and a $90 average callback, about $3 of it is already spoken for by your warranty. Illustrative example: 120 tickets, $14,400 revenue, $5,200 parts, $3,600 direct labor. Not a benchmark.
Revenue per ticket is the whole bar. Margin is the part on the right, and some of that is already promised to warranty callbacks.
What shops are saying

In the discussions the TCA reviewed, nearly everyone stated a price. One participant stated a margin: economy screens earning roughly $80 to $120 per repair and premium screens with a lifetime warranty earning roughly $150 to $220. That is one shop's figure, not an industry number, and the TCA is not offering a benchmark here. Another participant, in a separate discussion about economy screens, characterized the economy install as a one-time profit of about $30. If that is your margin on a ticket, a single callback erases it and the next one puts you underwater on the repair.

The more common pattern was quoting by formula. One participant described charging a flat labor amount plus a multiple of the part cost as the only shop in his town, and was surprised to learn others charge roughly double. Others described part cost plus a labor rate, a pricing matrix, or a bespoke database. None described checking margin before giving a quote.

One owner said most of his pricing is outdated, that he updates a price only when he happens to order or sell that part, and that keeping every price current as supplier costs move is not realistically possible. He is right that it is not realistic. It is also The Data Gap in an owner's words. The fix is not updating every price. The fix is knowing what a ticket leaves behind, on average, every month, so that when the number drops you find out before the bank does.

Subtract what your own warranty costs. Gross margin per ticket is what a repair leaves behind on the day. Some of that money is already spoken for, because a share of tickets will come back under warranty and you will do the second repair for free. The expected cost is simple: callback rate (number four) multiplied by what an average callback costs you in part, labor, and counter time. On the illustrative example, a 3.3 percent callback rate against a $90 average callback is about $3 per ticket, which is manageable. On a $30 economy install with a higher return rate, the same math can eat the whole ticket. Write the number down; it is the price of the promise on your receipt.

Run it by channel. If any of your tickets are paid by someone other than the customer in front of you, split the number. Walk-in repairs, insurance claims, third-party warranty program jobs, and business contracts each carry different revenue, parts rules, labor, and admin time, and a blended average hides which one is carrying the others. The section after number five walks through why.

Setting a target: the TCA is not going to hand you a margin target from a source that does not exist. Set your own: take last month's gross margin per ticket, then multiply by your monthly ticket count. If that total does not cover last month's fixed costs with room to spare, your target is the per-ticket number that would.

Number 2: What is my average ticket, and is it moving?

Average ticket = repair revenue divided by number of tickets, by month.

This is the easiest of the five to pull and the one most owners already half-know. Track it monthly and watch the trend, not the figure. Flat average ticket with rising parts cost is falling margin, even when revenue looks fine.

Where it lives: your POS. Same revenue and ticket count as number one.

What shops are saying

In a discussion about how to answer the phone when someone asks the price of a screen on a common model, quoted all-in prices for the same repair ranged from about $80 (part, labor, tax, and a one-year warranty) to about $140 (one-hour turnaround, lifetime warranty). One shop described three tiers on that one model, roughly $65, $95, and $145.

The same repair, on the same device, at nearly double the price. What separated the higher tickets was not a better negotiator. It was a warranty, a turnaround promise, or an extra question. One participant asks every caller whether they had a tempered glass protector and want one priced in, on the reasoning that a question creates the upsell that a flat price never does.

A different discussion, critiquing a shop's screen-tier flyer, went the other way: several participants argued for a single tier on the grounds that good OLED is now inexpensive enough that a budget option no longer earns its complexity. Some shops move average ticket by removing the bottom option.

Both are levers. Which one is right for your shop depends on your margin per ticket (number one) and your callback rate (number four). The December case study in this Guide is built around exactly this number, so record it now.

Number 3: How much of the day is billable?

Labor utilization = billable technician hours divided by paid technician hours.

You pay for every hour a technician is in the building. You only get paid for the hours that land on a ticket. The gap between them is diagnostics that did not convert, waiting on parts, counter time, cleanup, and the customer who wanted to talk for twenty minutes.

Where it lives: paid hours from payroll or your schedule; billable hours from your POS if it records time per ticket, or from a simple estimate per repair type multiplied by tickets completed. A rough number tracked every month beats a precise number tracked never.

Why 100 percent is impossible: nobody bills every paid minute. A technician who is at the bench all day still has intake, reassembly checks, part lookups, and the two-minute questions that turn into ten. Utilization is not a grade. It is a ratio you watch so you can tell whether a slow month was slow because the phone stopped ringing or because the bench got inefficient.

Setting a target: the TCA does not have a sourced industry range for repair-shop utilization and will not invent one. Measure yours for three months. The best of the three is your first target.

A worked example (illustrative): a technician is paid for 160 hours in a month. Tickets completed, at the shop's own time estimates, add up to 88 billable hours. Utilization is 55 percent. At that shop's labor rate, the owner can now see what the other 72 hours cost.

Labor utilization in the worked example A bar for 160 paid technician hours with 88 billable hours filled in, showing 55 percent utilization and 72 unbilled hours. Illustrative numbers. One technician, one month: 160 paid hours 88 billable hours (55%) 72 unbilled hourspaid for, not paid back Utilization is not a grade. It tells you whether a slow month was the phone or the bench. Illustrative example. The TCA has no sourced industry range for utilization; measure yours for three months and set your own target.
The gap between paid hours and billable hours is where the technician-pay math either holds or breaks.
What shops are saying

In the discussions the TCA reviewed, shops price around billable time all day without measuring it. One participant described the last two shops he worked in billing like auto mechanics at $80 an hour, which he said should now be closer to $100, with roughly half an hour charged on an older model. Another sets a $100 minimum and drops to $60 when the repair turns out to be quick. That is utilization logic without the vocabulary. In a discussion about phone scripts, one shop quotes a 45-minute turnaround as part of its intake conversation, which is a per-job time input if the shop chose to record it.

The largest discussion in the set, roughly 40 comments, was about technician pay. Stated hourly pay clustered around $15 to $20 for entry technicians and $20 to $25 for experienced ones, often with commission or tips added. One owner in a $15 minimum-wage market described paying a technician $17.50 and a manager who can solder $19.75. Another pays two leads about $22 with retirement matching and three weeks of paid time off. One tiered scale ran $15 for screens and modular work, $20 for soldering and refurb, and $25 for soldering, refurb, and unlocks. Two owners described profit-split arrangements. These are the figures participants stated. They are not a wage benchmark, and the next chapter will use the federal wage data for that.

Put the two threads side by side. Stated pay near $20 an hour. Stated labor near $85 an hour. That math only works if the technician is billable most of the day. No participant described tracking whether that is true.

If you are the only technician: several participants in the pay discussion were solo operators. One wrote that he does not pay himself. Another asked whether people really have employees. Utilization still applies. The paid hours are your hours in the shop, and the number tells you how much of your week is actually earning.

Number 4: How often does a repair come back?

Callback rate = warranty returns divided by completed repairs, over the same period.

A callback is not one cost. It is the second part, the second block of bench time, the technician pulled off a paying ticket, and a customer who now tells the story at dinner. On a thin-margin ticket it removes the whole margin. On a premium ticket it removes a slice of the margin and adds a slice of doubt.

Where it lives: your POS, if you flag warranty work as its own ticket type. If you do not, start Monday. Count every device that returns for any reason related to a prior repair, whether or not you decide it was a defect.

Count the disputes too. In a discussion about customer excuses for damage, owners cataloged post-repair blame: a screen that cracked on a short drop onto carpet attributed to a cheap part, battery and charging-port trouble attributed to a screen repair, a phone that supposedly fell off a nightstand arriving with damage consistent with being run over. Those are not defects. They still cost bench time, and the callback rate should capture them. Split the number into "our fault" and "not our fault" later if you want; get the total first.

What shops are saying

This is where the economy-versus-OLED argument from the top of the chapter comes back. Four discussions in a week. Strong positions on both sides. In one discussion the dominant view was that economy screens are suitable only for devices about to be traded in. One owner gave a same-day example of a customer who insisted on an economy screen against advice and whose screen misbehaved immediately. The owner who once sold OLED only argued the opposite.

The TCA is not going to settle that argument, and neither are you, until warranty returns divided by completed repairs is a number your shop tracks by part tier. At that point it stops being an argument.

Number 5: How long could the shop run on what is in the bank?

Months of cash reserve = cash on hand divided by average monthly fixed costs.

This is the survival number. It answers one question: if revenue stopped tomorrow, how many months would the shop stay open? A slow season, a lost lead technician, a landlord who does not renew, a supplier who changes terms. Each one is survivable with a reserve and fatal without one.

Where it lives: cash on hand from your business bank balance (not counting money already owed to suppliers or payroll due this week). Money an insurer or warranty program owes you is not cash on hand until it lands; track it separately as receivables, with the days it takes to arrive. Fixed costs from the last three months of bank statements: rent, utilities, software, insurance, loan payments, base payroll. Average them.

What shops are saying

Nothing. In the discussions the TCA reviewed this week, no participant mentioned reserves, runway, or months of expenses in the bank. That is the most telling silence in the set.

The idea is not foreign to repair owners. In a discussion about buying used devices that later turn out to be lost or stolen, owners described assuming every purchase will go bad and pricing accordingly, collecting ID and a signed bill of sale, or buying only unlocked devices. That is risk pricing, and shops already do it on intake. The reserve is the same idea applied to the whole business.

Setting a target: there is no sourced industry figure for how many months a repair shop should hold, and the TCA will not invent one. In Why Tech Repair Shops Fail, the TCA's self-assessment asked whether a shop has three months of operating expenses in reserve. Treat that as the TCA's rule of thumb, not a benchmark, and treat your calculated baseline as the number that matters. If the answer is under one month, that is the number to fix before any other project in this Guide. Set a target you can name, and put a fixed amount toward it every month before you spend on a new tool or a new location.

A worked example (illustrative): $18,000 in the business account against average fixed costs of $9,000 a month is two months of reserve.

Before you say yes to insurance and warranty program work

Somebody offers you volume. A device protection program, an insurance carrier's repair network, an extended warranty administrator, a mail-in fulfillment partner, a corporate fleet. Claims get routed to your shop, the bench stays full, and monthly revenue jumps. It looks like the thing every owner wants.

It can be. It is also the fastest way the TCA knows to build a busy shop with no margin, because program work quietly removes several of the levers you just read about.

Where the net goes:

  • You no longer set the price. Reimbursement is fixed by the program's fee schedule. Average ticket (number two) stops being a lever you control, and the add-on question that moves it does not exist on a claim.
  • You may not choose the part. Many programs specify the part grade or the supplier. Your parts cost is what they say it is, not what you negotiated.
  • Admin time does not bill. Claim portals, intake photos, pre-approvals, status updates, disputes, and resubmissions are real hours at the counter that never land on a ticket. Utilization (number three) drops and nobody sees it, because the bench still looks busy.
  • You get paid later. Program terms are often net 30, 45, or 60 days. You have already paid for the part and the technician. Until the remittance arrives you are financing the insurer, and that shows up in months of cash reserve (number five).
  • Claims get denied and clawed back. A rejected claim after the repair is done is a full-cost ticket at zero revenue.
  • You carry their warranty at your cost. Most programs require the shop to honor a warranty on the repair, often longer than the one you offer walk-ins, and the callback is usually on you. Your callback rate (number four) on program jobs is a direct cost with no upside.
  • The customer is not yours. They belong to the program. The repeat visit, the review, the referral, and the accessory sale rarely come back to your shop.

The test is the same five numbers, run for that channel alone. Take a month of program tickets. Reimbursement received, minus program-specified parts, minus direct labor, minus the admin hours at your technician's loaded rate, minus the expected warranty cost (the program's callback rate times what a callback costs you). Divide by program tickets. That is your true margin per program ticket. Multiply by monthly program volume and put it beside the walk-in margin those same bench hours could have earned. Then ask how many weeks of payables you are covering while you wait to be paid, and whether your cash reserve absorbs it.

A worked example (illustrative numbers, not a benchmark): a program pays $180 for a screen claim. The required part costs $95, direct labor is $30, and the technician spends 20 minutes on the claim portal at a loaded $25 an hour, call it $8. That leaves $47 before warranty. If program jobs come back at 5 percent and a callback costs the shop $110 in part and labor, expected warranty cost is about $5.50, so the ticket nets roughly $41. Now hold that $41 against a payment that arrives in 45 days and a walk-in ticket that pays today. Whether that works is not a matter of opinion. It is a matter of which number is bigger for your shop.

What a $180 program claim actually nets in the worked example A step-down chart from $180 reimbursement: minus $95 required part, minus $30 labor, minus $8 unbilled admin, minus $5.50 expected warranty cost, leaving about $41 that arrives in 45 days. Illustrative numbers. A $180 program claim, after everything the program takes off it Reimbursement $180.00 Required part $95.00 Labor $30.00 Admin $8.00 Expected warranty $5.50 Nets about $41 Paid in 45 days. You covered the part and the technician on day one. Hold the $41 against the walk-in ticket that same bench hour could have earned, paid today. Program work is a filler, not a foundation. Illustrative example: 20 minutes of claim admin at a loaded $25 an hour; 5 percent callback rate against a $110 callback. Not a benchmark.
Gross revenue on a program claim looks fine. The net, after the part they chose, the admin they require, and the warranty you carry, is the number to compare.

Do they make enough to support the warranty? Only the channel math answers that. If the true margin per program ticket is positive after admin time and expected callbacks, and the payment lag fits inside your cash reserve without squeezing suppliers or payroll, the work stands on its own and can be a sensible way to fill idle bench hours. If the margin only looks positive before admin and warranty are counted, or if the receivable lag is being carried by your walk-in cash, you are not running a repair program. You are lending the insurer money at zero percent and paying for the privilege with your bench.

The TCA's position: program work is a filler, not a foundation. Take it when it clears its own margin and you have the reserve to wait for payment. Never build the shop's revenue base on it, because the day the program changes its fee schedule or its network, that revenue leaves the same way it arrived.

How to capture all five in under an hour a week

You do not need new software. You need one sheet and one recurring hour. The Five Numbers worksheet is a free PDF with the nine inputs, the five formulas, and a target line for each; print it or fill it in on screen.

The weekly hour: nine inputs become five numbers Diagram. Weekly, about 30 minutes: six inputs from POS, parts invoices, and schedule. Monthly, about 20 minutes: three inputs from bank and payroll. Together they produce the five numbers. Weekly, about 30 minutes POS: revenue, tickets, warranty tickets Parts invoices: parts spent Schedule: paid hours, billable hours 6 inputs Monthly, about 20 min Bank: cash on hand Bank: fixed costs Payroll: direct labor cost 3 inputs 5 numbers margin per ticket average ticket utilization callbacks, reserve Nine inputs you already have. Keep every month's sheet and the trend builds itself.
Under an hour a week, and none of the inputs require new software.

Weekly (about 30 minutes):

  1. Pull from your POS: repair revenue, tickets completed, warranty tickets. Three numbers.
  2. Pull from your parts invoices: parts spent this week. One number.
  3. Pull from your schedule or timeclock: paid technician hours. Estimate billable hours from tickets completed if your POS does not track time. Two numbers.

Monthly (about 20 minutes, on top of the last weekly session):

  1. Pull from the bank: cash on hand and the fixed-cost total for the month. Two numbers.
  2. Pull from payroll: direct technician labor cost for the month. One number.

Nine inputs, five formulas, five answers. Keep every month's sheet and the trend builds itself. If you take insurance or warranty program work, the second page of the worksheet runs the same numbers by channel, with a line for receivables and expected warranty cost. The first month is your baseline. The number you fill in first should be the one you found yourself arguing about this week.

The TCA's Take

This section is the TCA's position, not a finding from the community evidence above.

A shop that cannot state these five numbers is not ready to add a service line, a location, or a hire. Fix the Shop First applies here in full. The TCA has watched owners add data recovery, a second storefront, or a second technician on the strength of "we're busy," and busy is not a number.

Every objection the TCA heard this week has the same answer.

"The chain in the next town caps my price." Then the ceiling is not yours to control, and the floor is the only thing you own. You cannot set a floor you have not measured.

"I can't keep every price current." Correct. Nobody can. You can know, every month, what a ticket leaves behind. When that number drops, you go find out which prices moved.

"Economy screens are fine." "Economy screens are killing your brand." Whichever side you are on, you are guessing until warranty returns divided by completed repairs is a number you track.

"I'm solo, I don't have payroll." You have hours. The number still works.

"Reserves are for bigger shops." You already price for risk on every used device you buy. This is the same discipline, one level up.

"Insurance work keeps my bench full." Full at what margin, paid in how many days, with whose warranty on it? Run the channel on its own. If it stands, keep it. If it only stands on your walk-in cash, it is not income, it is a loan you made.

The next chapter in this Guide is about pricing labor. Do not start it with a labor rate. Start it with these five numbers filled in for last month, or you will be setting a price for a shop you have not measured.

What to do Monday morning

  1. Open the Five Numbers worksheet and fill in last month. Nine inputs, five outputs. Do not chase precision on the first pass; chase completion.
  2. Circle the one number you were arguing about with someone this week. Margin, price, hours, callbacks, or cash. That is the one you improve first. Pick one lever from the matching section above and write down what you will change.
  3. Put the same hour on next Monday's calendar. Re-measure. The second month is where the trend starts and the guessing stops.

Busy is a feeling. Profitable is a number.

Every owner in the discussions the TCA reviewed this week could tell you their labor price. Almost none could tell you what a ticket leaves behind, how much of the bench is billable, how often a repair comes back, or how many months the shop could run on what is in the bank. Those are not accounting questions. They are the difference between a shop that is busy and a shop that survives, and every one of them takes less than an hour a week to know.

Next Tuesday, the series turns to pricing labor. Do not start that chapter with a rate. Start it with these five numbers filled in for last month.

Start here. Free, one page, no signup.

Download the Five Numbers worksheet (PDF)

How healthy is your shop, really?

TCA ShopCheck is a free two-minute health check built for independent repair shops. Your Run It Well score is the fast version of this chapter; the worksheet is the detail behind it.

Run TCA ShopCheck Free

Common questions about repair shop profitability

What is gross margin per ticket for a repair shop?

Gross margin per ticket is the money left on an average repair after the part and the direct technician labor are paid, before rent and other overhead. The formula is (repair revenue minus parts cost minus direct labor cost) divided by tickets completed. It is the number that separates a busy shop from a profitable one.

What is a good callback rate for a tech repair shop?

The TCA has not published a benchmark for callback rate and does not recommend using one from an unsourced list. Calculate yours as warranty returns divided by completed repairs, including disputes that are not defects, then track it by part tier. Your first target is your own best month.

How many months of cash reserve should a repair shop have?

There is no sourced industry figure. The TCA's rule of thumb, from Why Tech Repair Shops Fail, is three months of operating expenses. Calculate your own as cash on hand divided by average monthly fixed costs. If it is under one month, that is the number to fix before any other project.

Should a repair shop take insurance or warranty program work?

Only when it clears its own margin. Run the five numbers for the program channel alone: reimbursement minus required parts, direct labor, unbilled admin time, and expected warranty cost, divided by program tickets, then check whether the payment lag fits inside your cash reserve. Program work is a filler for idle bench hours, not a foundation for the business.

How long does it take to track these five numbers?

Under an hour a week: about 30 minutes weekly for six inputs from your POS, parts invoices, and schedule, plus about 20 minutes monthly for three inputs from the bank and payroll. The free Five Numbers worksheet has the formulas printed beside each input.

More from the TCA Blog

Rob Link is the founder of the TCA. He built and ran a multi-location repair chain in an earlier era of this industry, and he'd tell you today's operators have it harder. The TCA is independent of carriers, manufacturers, and insurance companies, which is exactly why it can tell shop owners the truth about growth.

Sources and methodology

  • Retail failure rates: U.S. Bureau of Labor Statistics data as analyzed by Commerce Institute, "What Percentage of Businesses Fail Each Year?" (2025). Confirmed against the source on September 13, 2026.
  • Tech repair failure and exit estimates: Tech Care Association internal research, published in Why Tech Repair Shops Fail, March 16, 2026. These are TCA estimates, not government statistics.
  • Cost of missing data: Tech Care Association estimates published in The Data Gap, January 19, 2026.
  • U.S. shop count: TCA working estimate of roughly 40,000 independent tech repair businesses. No authoritative count exists.
  • All-industry failure rates (20.4 percent first year, 49.4 percent by year five): U.S. Bureau of Labor Statistics data as analyzed by Commerce Institute (2025).
  • Small business cash flow and time findings: Bluevine, "3 in 4 owners say owning a business is worth it, despite challenges," April 2026; survey of 785 U.S. small business owners fielded by Centiment, Feb. 2 to 11, 2026.
  • Startup failure reasons: CB Insights, "The top 9 reasons startups fail," March 5, 2026; analysis of 431 VC-backed companies that shut down since 2023.
  • Worked examples in this chapter use illustrative numbers chosen to show the formulas. They are not industry benchmarks, and the TCA has not published a benchmark for any of the five numbers.

About this data: The TCA reviewed approximately 290 comments from repair professionals participating in 22 online industry discussions between September 9 and 13, 2026. These discussions were voluntary and were not collected through a representative survey. Findings describe the comments reviewed and should not be interpreted as estimates for the entire repair industry. Comments from parts vendors and service resellers were excluded. Individual participants are not identified without permission.

Published September 16, 2026. Last updated September 16, 2026.

The most dangerous sentence in tech repair might be “I’ve got another idea.” Before you add another service, product, location, or revenue stream, make the repair business work. If you want to grow a tech repair business, this is where you start. Part 1 of a nine-part TCA series on building from strength.

Fix the Shop First · Part 1 of 9

By Rob Link, Founder & CEO, Tech Care Association · September 1, 2026 · 10 min read

Key Takeaways

  • A good idea and hard work are not enough. You also need market demand, cash flow, the right team, operational planning, and timing. Most hard workers who fail run out of money or build something nobody wants to buy.
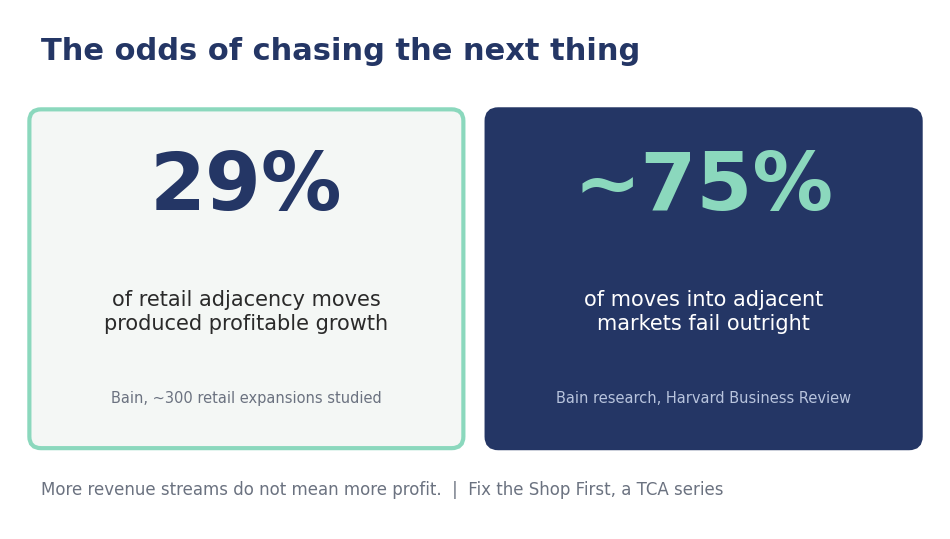
  • The research is blunt: Bain found only 29% of retail adjacency moves produced profitable growth, and roughly three-quarters of attempts to grow into adjacent markets fail. The winners almost always had a strong core business first.
  • More revenue streams do not mean more profit. Every new offering consumes capital, inventory, training, attention, floor space, and time.
  • Broadening your repair capability is not the same as diluting your business model. Repairing more devices is still one business. Running repair plus resale plus IT services plus recycling plus insurance may be several mediocre ones.
  • Expand only when the core has earned you the right to expand. This series will show you how to know when that is.

What’s in this post

  1. What I heard on the show floor
  2. A week in the life of a distracted owner
  3. The game has changed: everyone has insurance now
  4. Why a good idea and hard work are not enough
  5. What the research says about chasing adjacencies
  6. Broaden your capability, don’t dilute your model
  7. You can’t fix what you don’t measure
  8. Find people who will pick your idea apart
  9. What’s coming in this series
  10. Common questions about repair shop focus

What I heard on the show floor

Two weeks ago I spent two days at booth 835 at AWPE in Las Vegas, where the TCA launched TCA ShopCheck. Between demos, I did what I always do at these shows. I talked to operators. Owners of one shop, owners of five, techs planning their first storefront, and veterans who have been at the bench since the first iPhone cracked. Almost all of them want the same thing: to grow a tech repair business that lasts.

Add in the conversations from Mobile Disrupt in Miami back in July and the ITAD Summit in early August, and I’ve spent a lot of 2026 listening to some of the most capable people in this industry. Here’s what struck me most.

It wasn’t the struggling shops that worried me. It was the successful ones.

Some of the sharpest, most productive owners I talked to this summer are wrestling with focus and direction. They have healthy shops, good reputations, and money in the bank, and they’re restless. They’re eyeing spaces that are already crowded with established players. Or they’re gearing up to build something that others in this industry have already tried and failed at, without any real data on what worked and what didn’t the first time around. They have a good idea, they’re willing to outwork anyone, and they assume that combination is enough.

It isn’t. And the numbers on that are brutal, which we’ll get to in a minute.

First, let me describe an owner I met about six times this summer, under six different names and faces.

A week in the life of a distracted owner

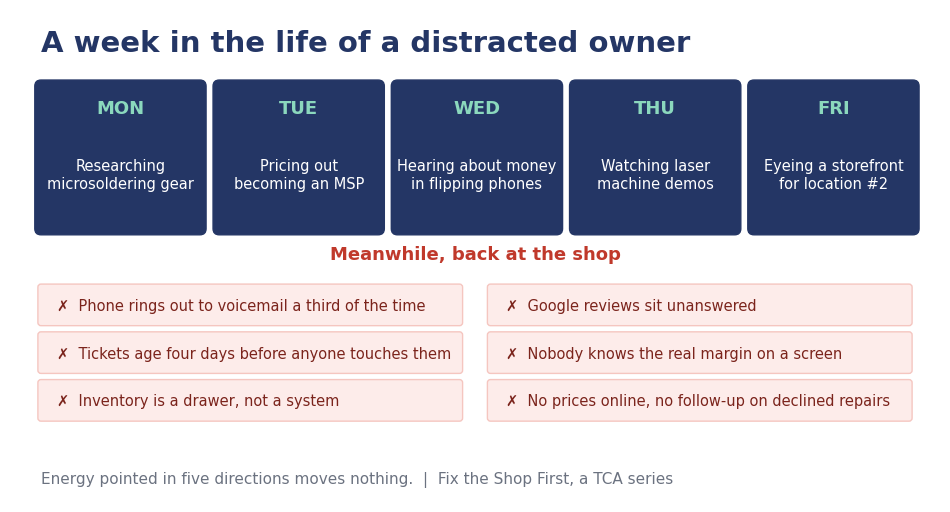
Monday, they’re researching microsoldering equipment. Tuesday, they’re pricing out what it would take to become a managed service provider. Wednesday, a buddy tells them there’s huge money in buying and flipping used phones. Thursday, they’re watching demos of laser machines. Friday, they’re driving past a vacant storefront across town thinking about location number two.

Meanwhile, back at the shop

Back at the shop they already own:

  • The phone rings out to voicemail a third of the time.
  • Google reviews sit unanswered, including the bad one from last month.
  • Repair tickets are aging four days before anyone touches them.
  • Nobody, including the owner, knows the actual gross margin on a screen replacement.
  • Inventory is a drawer, not a system.
  • The website doesn’t show prices.
  • Customers who declined a repair never hear from the shop again.

Graphic showing a repair shop owner researching microsoldering, MSP services, phone flipping, laser machines, and a second location Monday through Friday, while unanswered calls, aging tickets, unknown margins, and uncontrolled inventory pile up back at the shop

I’m not picking on this owner, whoever they are, wherever you are. I ran a thirteen-location chain back in the day, and I was this owner. And I’ll be the first to admit the game was easier then. The industry has changed, and today’s operators face far more competition than we ever did, from combo shops and kiosks to mobile operators, all fighting for the same customers. That’s an argument for more focus, not less. Repair shop owners are entrepreneurs, and entrepreneurs see opportunity everywhere. Accessories. Used devices. IT services. Data recovery. Recycling. B2B contracts. Mail-in. That instinct built this industry.

But every one of those opportunities consumes some combination of capital, inventory, training, marketing, management attention, floor space, and time. And the TCA’s own research this spring showed exactly where that attention should be going instead. Our May report on why repair shops are losing customers to replacement found that shops are bleeding business over the basics: unanswered calls, poor communication, pricing friction, and a buying experience that makes repair harder to choose than replacement.

Before asking what else you can sell, ask how much more repair business you could capture by getting better at the business you’re already in.

The game has changed: everyone has insurance now

Direct answer
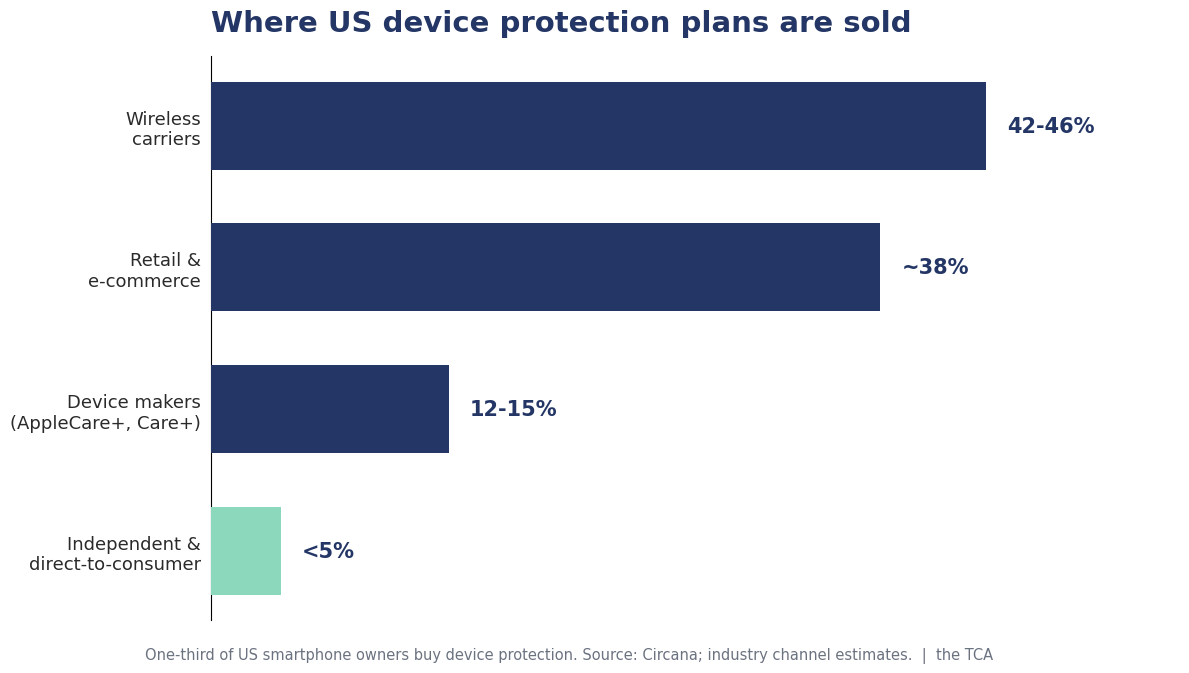
The single most talked-about change in today’s repair world is device protection. One-third of US smartphone owners now purchase protection for their devices, according to consumer tracking firm Circana, and nearly all of those plans are sold through channels that route repairs to a handful of giant operators before an independent shop ever sees the device.

Where the protection plans get sold

Sit with that number. A third of the smartphones in your market may already have a repair path decided before they ever break. And look at where those protection plans get sold. Wireless carriers are the leading channel, bundling protection at the point of sale, with those policies serviced almost entirely by two massive operators. Big-box retail and e-commerce make up the next major slice, powered behind the scenes by the same few giants. Device makers hold a smaller share through their own branded care programs. Independent and direct-to-consumer channels? They control under five percent of the market.

Bar chart showing where US device protection plans are sold: wireless carriers lead at roughly 44 percent, retailers and e-commerce near 38 percent, device manufacturers around 13 percent, and independent channels under 5 percent

If you read our Operators in Motion piece, this should sound familiar. The two biggest repair-network exits of the last era both landed inside insurance companies, because those companies need repair capability to deliver what they sell. The protection economy sits on top of our industry and pre-routes an enormous share of the work.

Here’s what that means for the thesis of this series. It does not mean run out and start selling protection plans; that’s the chasing reflex this series exists to interrupt, and you’d be walking into the most consolidated corner of the entire market. It means the customers who are still choosing their own repair shop, the majority who skip protection plus everyone whose plan disappoints them, choose on trust, speed, reviews, and experience. The shops that win them are the ones that fixed the shop first. That is how you grow a tech repair business in a market where a third of the customers are spoken for before the screen ever cracks.

Why a good idea and hard work are not enough

Here’s the uncomfortable truth behind those show-floor conversations. A good idea and hard work are the entry fee, not the win condition. Plenty of hard workers fail every year because nobody wants to buy what they built, or because the money ran out before the market showed up. To succeed, you also need at least four other things:

Market demand

People have to want to buy what you’re selling, in your market, at your price. And not every idea or product plays well in every market: what thrives in a college town can starve in a retiree suburb, and what works in a dense city can flop in a rural county. If the market is too small or simply doesn’t care, working harder will not fix it. This is where “the space is already crowded” and “somebody already tried this here and it died” should be treated as data, not as challenges to your pride.

Cash flow

You need money to pay the bills before the new thing turns a profit, and new ventures always take longer than the plan says. Running out of cash is the most common way a new business closes, and it’s how a healthy repair shop gets dragged down by its own side project.

Timing

Launching too early or too late can kill a genuinely great idea. Some of the failures in this industry weren’t bad ideas. They were right ideas at the wrong moment, and the person trying it again five years later without understanding why it failed the first time is set up to repeat the result.

Smart strategy and the right team

Working hard on the wrong tasks wastes the one resource you can’t buy more of. You need a clear plan, the right skills, and people besides yourself who can run the thing.

Part 2 of this series digs into each of these in detail. For now, hold onto the pattern: the graveyard of this industry is full of good ideas executed by hard workers who were missing one of those four ingredients.

What the research says about chasing adjacencies

This isn’t just my read from the show floor. The business research on how companies try to grow, and how often expansion backfires, is remarkably consistent, and remarkably grim.

Bain & Company studied nearly 300 adjacency moves by retailers, meaning expansions into products, services, and markets next to the core business. Only 29% produced profitable growth. Only 15% produced significant increases in both revenue and profit. The strongest predictor of success was how close the expansion stayed to the company’s existing customers, capabilities, and cost structure.

A related Bain study published in Harvard Business Review put it even more starkly: roughly three-quarters of attempts to grow into adjacent markets fail. And the companies that did succeed at adjacency expansion had one thing in common. They already had strong core businesses before they expanded.

Then there’s the complexity problem. Research summarized in Harvard Business Review found that most businesses offer more products and services than the profit-maximizing number. Every additional offering creates operational complexity, and the cost of that complexity quietly eats into margins long before anyone notices it on a spreadsheet.

Stat graphic on why chasing adjacencies is a risky way to grow a tech repair business: only 29 percent of retail adjacency moves produced profitable growth and roughly 75 percent of adjacent market expansion attempts fail, per Bain research

Put those findings together and you get the sentence I want every shop owner to tape above the bench:

More revenue streams do not mean more profit.

A shop doing $700,000 of complicated, poorly managed business across six ventures is not healthier than a shop doing $500,000 of highly repeatable repair work at strong margins. The second owner sleeps better, banks more, and is in a far stronger position to grow a tech repair business later, on purpose, from strength.

Broaden your capability, don’t dilute your model

Now, if you’ve been reading the TCA blog for a while, you might be raising an eyebrow. Haven’t we spent the past year telling you the opposite?

We published Beyond Phone Repair, showing that your skills already transfer across ten consumer electronics categories. We published Operators in Motion, celebrating owners who grew from the bench into refurbishment, ITAD, resale, and software. We’ve covered data recovery as an expanding profit center. We stand behind every word of it.

This series is not a retraction. It’s the missing chapter.

Here’s the distinction that resolves it. A shop repairing phones, tablets, laptops, consoles, and wearables is still fundamentally running one repair business. Same skills, same workflow, same customer promise, wider funnel. That’s broadening your capability, and it’s usually smart.

A shop simultaneously trying to operate repair plus prepaid wireless plus used-device retail plus IT services plus eBay resale plus recycling plus insurance sales may be running seven mediocre businesses out of one storefront. That’s diluting your model, and it’s usually how good shops become tired shops.

Comparison graphic: one repair business covering phones, tablets, laptops, consoles, and wearables versus eight separate businesses crammed into one storefront, illustrating broadening capability versus diluting the business model

Ask the uncomfortable questions first

So before you bolt anything new onto the counter, ask yourself some uncomfortable questions. Do your customers actually want additional products and services from you, or do they want you to do more of the core repair work they already trust you with? If you sell them something they didn’t come for, can it hurt the business you already have? Do they want to deal with a salesperson or a repair person? And if you push sales too hard, does it damage the trust that drives your repair traffic in the first place? Every one of those answers decides whether you grow a tech repair business or merely complicate one.

My honest take, after two decades in this trade: people come to you for repair, and repair only. Layering sales on top of that relationship is much harder than it looks, and very few shops pull it off without eroding the thing that made customers walk in.

Every operator in motion we profiled earned the move first. Their pattern was never “chase everything.” It was master the core, systemize it, and then expand from strength into work that used the same customers, skills, and trust they’d already built. Expansion is a multiplier. Multiply a strong operation and you get growth. Multiply a broken operation and you get a bigger broken operation.

Expand only when the core has earned you the right to expand.

You can’t fix what you don’t measure

So how do you know whether your core has earned it? You measure it. Honestly, and from the outside. Nobody has ever managed to grow a tech repair business on numbers they didn’t know.

That’s exactly why the TCA built TCA ShopCheck, the free shop health check we launched at AWPE last month. In about two minutes, it scores your business across the five things that actually determine whether the core is strong: whether customers can find you, whether they choose you, whether you win the job, whether you run the operation well, and whether you’re set up to grow. It’s free, it stays free, and it exists because most owners have never had an objective look at their own shop.

Run it before you spend another hour researching that laser machine. If the score stings a little, good. That sting is the gap between the business you have and the business you could have without adding a single new venture.

And keep an eye on this space. TCA ShopCheck is the first tool in what we’re building into a full suite, with more advanced tools coming that go deeper into analyzing your operations, your numbers, and your readiness to expand. The shops that measure will always beat the shops that guess.

Find people who will pick your idea apart

One more thing before I lay out the series, because it came up in almost every one of those show-floor conversations.

The owners chasing crowded spaces and repeating past failures had something in common: everyone around them loved the idea. Their techs loved it. Their regulars loved it. Their Facebook group loved it. What they didn’t have was a single person with real authority and experience whose job was to pick the idea apart.

Your fans are great at identifying their problems and terrible at inventing your solutions. There’s a famous line, probably apocryphal, attributed to Henry Ford: if he’d asked people what they wanted, they’d have said faster horses. Customers ask for incremental versions of what already exists. Your loudest supporters don’t represent your average customer. And people will enthusiastically tell you they want something right up until you ask them to pay for it.

What you need is hard, honest feedback from people with the experience to know where the bodies are buried. People who will ask what the market demand actually is, what happened to the last three shops that tried it, and what your cash position looks like in month nine. That kind of feedback is uncomfortable, and it is worth more than a hundred likes. Part 5 of this series is entirely about where to find it and how to use it.

What’s coming in this series

Over the next several weeks, Fix the Shop First will build the complete argument, and the complete toolkit:

  1. Stop Chasing the Next Thing: Fix the Shop First (you’re reading it)
  2. The Industry With No Giants: why an industry this big has no dominant players, and what the churn rate is telling us
  3. A Good Idea and Hard Work Are Not Enough: the four ingredients that actually determine success
  4. Do You Actually Have a Profitable Repair Business?: the numbers every owner must know cold
  5. The Boring Stuff Is Where the Money Is (and Facebook Isn’t): the six figures hiding inside the shop you already own
  6. Your Fans Are Lying to You (Kindly): how to get feedback that actually protects you
  7. Everybody’s Right and Everybody’s Wrong: the silo problem, and how to vet the voices you follow
  8. When You Should Add Something New: the TCA Expansion Test
  9. Build Your Repair Machine: the TCA Core-First Growth Model

By the end, you’ll have a framework for knowing exactly when your shop has earned the right to expand, a plan for what to do until then, and a clear answer to the question every owner eventually asks: how do I grow a tech repair business without breaking the one I have?

Common questions about repair shop focus

Should a tech repair shop diversify into new revenue streams?

Only after the core repair business is consistently profitable, measured, and able to run without the owner touching everything. Research on business adjacency moves shows roughly three-quarters fail, and the successes almost always came from companies with strong core businesses first. Expansion multiplies whatever you already have, strong or broken.

Is repairing more types of devices the same as diversifying?

No. Adding tablets, laptops, consoles, and wearables to a phone repair shop broadens one repair business using the same skills, workflow, and customer trust. Diversifying means running fundamentally different businesses, like resale, IT services, recycling, and insurance, from the same storefront. The first widens your funnel. The second divides your attention.

How do I know if my repair shop is ready to grow a tech repair business beyond repair?

Start by measuring the core objectively. TCA ShopCheck is a free two-minute health check that scores your shop on getting found, getting chosen, winning the job, running well, and growing. If the core scores strong and you can answer the market demand, cash flow, timing, and team questions honestly, you’re ready to run the TCA Expansion Test coming later in this series.

Want to grow a tech repair business? The next thing can wait. The shop can’t.

If you walked one of those show floors with me this summer, you saw an industry full of energy, ideas, and ambition. That’s our strength. But energy pointed in six directions moves nothing. The owners who win over the next five years won’t be the ones with the most ideas. They’ll be the ones who built one great repair business first, measured it honestly, listened to people willing to tell them the truth, and then expanded from strength.

Next Tuesday, Part 2 asks the question hiding underneath all of this: why has an industry this large produced almost no giants? The answer lives in our brutal churn numbers, a century-old trade route working against us, and a focus problem nobody wants to name. If you’ve ever wondered why the revolving door of shops opening and closing never stops spinning, that post is for you.

Until then, run your shop through TCA ShopCheck. It takes two minutes, it’s free, and it might be the most honest conversation your business has had in years.

How healthy is your shop, really?

TCA ShopCheck is a free two-minute health check built for independent repair shops. No sales pitch, no strings. Just an honest score and a place to start.

Run TCA ShopCheck Free

More from the TCA Blog

Rob Link is the founder of the TCA. He built and ran a multi-location repair chain in an earlier era of this industry, and he’d tell you today’s operators have it harder. The TCA is independent of carriers, manufacturers, and insurance companies, which is exactly why it can tell shop owners the truth about growth.

Sources: Circana, smartphone protection purchase data (2025). Bain & Company, “Growing Beyond Your Core in Retail” (study of nearly 300 retail adjacency moves). Zook & Allen, “Growth Outside the Core,” Harvard Business Review. Gottfredson & Aspinall, “Innovation Versus Complexity: What Is Too Much of a Good Thing?”, Harvard Business Review. The TCA’s State of Tech Repair 2026 research. The Tech Care Association (TCA) is the leading nonprofit trade association for independent tech repair professionals in North America.