Posts

The most dangerous sentence in tech repair might be “I’ve got another idea.” Before you add another service, product, location, or revenue stream, make the repair business work. If you want to grow a tech repair business, this is where you start. Part 1 of a nine-part TCA series on building from strength.

Fix the Shop First · Part 1 of 9

By Rob Link, Founder & CEO, Tech Care Association · September 1, 2026 · 10 min read

Key Takeaways

  • A good idea and hard work are not enough. You also need market demand, cash flow, the right team, operational planning, and timing. Most hard workers who fail run out of money or build something nobody wants to buy.
  • The research is blunt: Bain found only 29% of retail adjacency moves produced profitable growth, and roughly three-quarters of attempts to grow into adjacent markets fail. The winners almost always had a strong core business first.
  • More revenue streams do not mean more profit. Every new offering consumes capital, inventory, training, attention, floor space, and time.
  • Broadening your repair capability is not the same as diluting your business model. Repairing more devices is still one business. Running repair plus resale plus IT services plus recycling plus insurance may be several mediocre ones.
  • Expand only when the core has earned you the right to expand. This series will show you how to know when that is.

What’s in this post

  1. What I heard on the show floor
  2. A week in the life of a distracted owner
  3. The game has changed: everyone has insurance now
  4. Why a good idea and hard work are not enough
  5. What the research says about chasing adjacencies
  6. Broaden your capability, don’t dilute your model
  7. You can’t fix what you don’t measure
  8. Find people who will pick your idea apart
  9. What’s coming in this series
  10. Common questions about repair shop focus

What I heard on the show floor

Two weeks ago I spent two days at booth 835 at AWPE in Las Vegas, where the TCA launched TCA ShopCheck. Between demos, I did what I always do at these shows. I talked to operators. Owners of one shop, owners of five, techs planning their first storefront, and veterans who have been at the bench since the first iPhone cracked. Almost all of them want the same thing: to grow a tech repair business that lasts.

Add in the conversations from Mobile Disrupt in Miami back in July and the ITAD Summit in early August, and I’ve spent a lot of 2026 listening to some of the most capable people in this industry. Here’s what struck me most.

It wasn’t the struggling shops that worried me. It was the successful ones.

Some of the sharpest, most productive owners I talked to this summer are wrestling with focus and direction. They have healthy shops, good reputations, and money in the bank, and they’re restless. They’re eyeing spaces that are already crowded with established players. Or they’re gearing up to build something that others in this industry have already tried and failed at, without any real data on what worked and what didn’t the first time around. They have a good idea, they’re willing to outwork anyone, and they assume that combination is enough.

It isn’t. And the numbers on that are brutal, which we’ll get to in a minute.

First, let me describe an owner I met about six times this summer, under six different names and faces.

A week in the life of a distracted owner

Monday, they’re researching microsoldering equipment. Tuesday, they’re pricing out what it would take to become a managed service provider. Wednesday, a buddy tells them there’s huge money in buying and flipping used phones. Thursday, they’re watching demos of laser machines. Friday, they’re driving past a vacant storefront across town thinking about location number two.

Meanwhile, back at the shop

Back at the shop they already own:

  • The phone rings out to voicemail a third of the time.
  • Google reviews sit unanswered, including the bad one from last month.
  • Repair tickets are aging four days before anyone touches them.
  • Nobody, including the owner, knows the actual gross margin on a screen replacement.
  • Inventory is a drawer, not a system.
  • The website doesn’t show prices.
  • Customers who declined a repair never hear from the shop again.
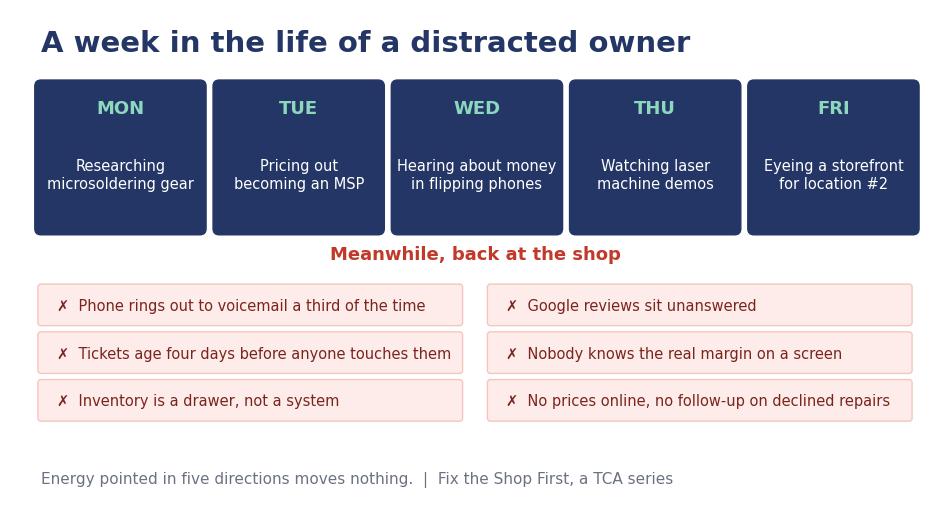
Graphic showing a repair shop owner researching microsoldering, MSP services, phone flipping, laser machines, and a second location Monday through Friday, while unanswered calls, aging tickets, unknown margins, and uncontrolled inventory pile up back at the shop

I’m not picking on this owner, whoever they are, wherever you are. I ran a thirteen-location chain back in the day, and I was this owner. And I’ll be the first to admit the game was easier then. The industry has changed, and today’s operators face far more competition than we ever did, from combo shops and kiosks to mobile operators, all fighting for the same customers. That’s an argument for more focus, not less. Repair shop owners are entrepreneurs, and entrepreneurs see opportunity everywhere. Accessories. Used devices. IT services. Data recovery. Recycling. B2B contracts. Mail-in. That instinct built this industry.

But every one of those opportunities consumes some combination of capital, inventory, training, marketing, management attention, floor space, and time. And the TCA’s own research this spring showed exactly where that attention should be going instead. Our May report on why repair shops are losing customers to replacement found that shops are bleeding business over the basics: unanswered calls, poor communication, pricing friction, and a buying experience that makes repair harder to choose than replacement.

Before asking what else you can sell, ask how much more repair business you could capture by getting better at the business you’re already in.

The game has changed: everyone has insurance now

Direct answer
The single most talked-about change in today’s repair world is device protection. One-third of US smartphone owners now purchase protection for their devices, according to consumer tracking firm Circana, and nearly all of those plans are sold through channels that route repairs to a handful of giant operators before an independent shop ever sees the device.

Where the protection plans get sold

Sit with that number. A third of the smartphones in your market may already have a repair path decided before they ever break. And look at where those protection plans get sold. Wireless carriers are the leading channel, bundling protection at the point of sale, with those policies serviced almost entirely by two massive operators. Big-box retail and e-commerce make up the next major slice, powered behind the scenes by the same few giants. Device makers hold a smaller share through their own branded care programs. Independent and direct-to-consumer channels? They control under five percent of the market.
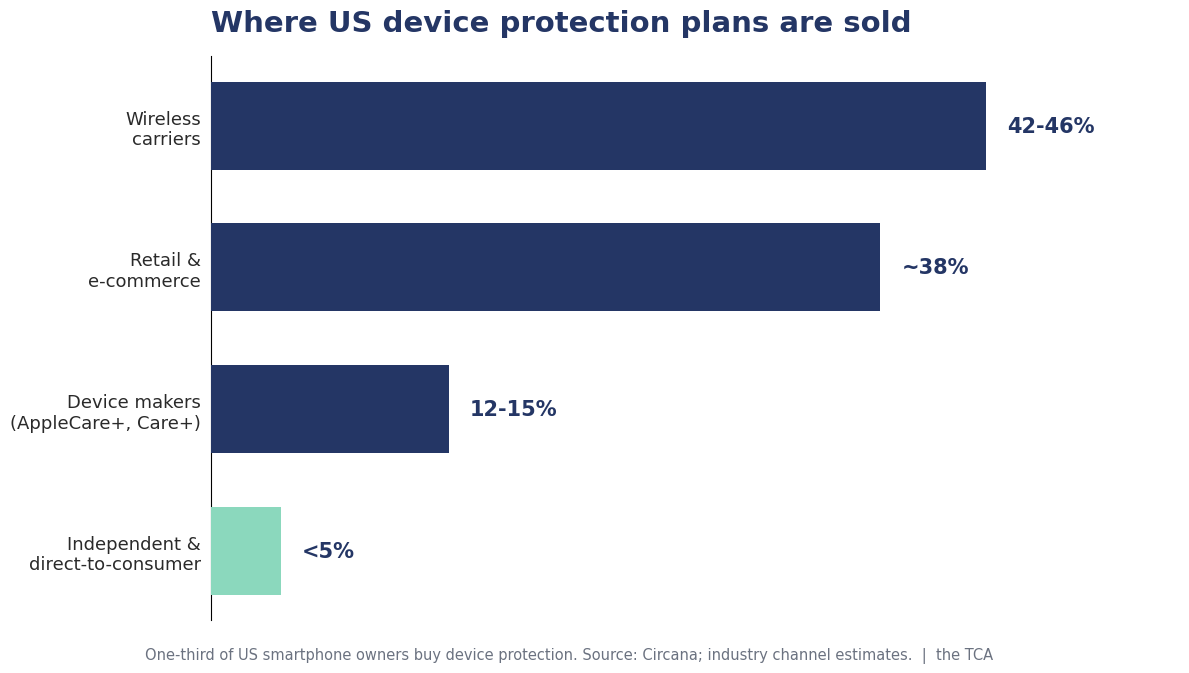
Bar chart showing where US device protection plans are sold: wireless carriers lead at roughly 44 percent, retailers and e-commerce near 38 percent, device manufacturers around 13 percent, and independent channels under 5 percent

If you read our Operators in Motion piece, this should sound familiar. The two biggest repair-network exits of the last era both landed inside insurance companies, because those companies need repair capability to deliver what they sell. The protection economy sits on top of our industry and pre-routes an enormous share of the work.

Here’s what that means for the thesis of this series. It does not mean run out and start selling protection plans; that’s the chasing reflex this series exists to interrupt, and you’d be walking into the most consolidated corner of the entire market. It means the customers who are still choosing their own repair shop, the majority who skip protection plus everyone whose plan disappoints them, choose on trust, speed, reviews, and experience. The shops that win them are the ones that fixed the shop first. That is how you grow a tech repair business in a market where a third of the customers are spoken for before the screen ever cracks.

Why a good idea and hard work are not enough

Here’s the uncomfortable truth behind those show-floor conversations. A good idea and hard work are the entry fee, not the win condition. Plenty of hard workers fail every year because nobody wants to buy what they built, or because the money ran out before the market showed up. To succeed, you also need at least four other things:

Market demand

People have to want to buy what you’re selling, in your market, at your price. And not every idea or product plays well in every market: what thrives in a college town can starve in a retiree suburb, and what works in a dense city can flop in a rural county. If the market is too small or simply doesn’t care, working harder will not fix it. This is where “the space is already crowded” and “somebody already tried this here and it died” should be treated as data, not as challenges to your pride.

Cash flow

You need money to pay the bills before the new thing turns a profit, and new ventures always take longer than the plan says. Running out of cash is the most common way a new business closes, and it’s how a healthy repair shop gets dragged down by its own side project.

Timing

Launching too early or too late can kill a genuinely great idea. Some of the failures in this industry weren’t bad ideas. They were right ideas at the wrong moment, and the person trying it again five years later without understanding why it failed the first time is set up to repeat the result.

Smart strategy and the right team

Working hard on the wrong tasks wastes the one resource you can’t buy more of. You need a clear plan, the right skills, and people besides yourself who can run the thing.

Part 2 of this series digs into each of these in detail. For now, hold onto the pattern: the graveyard of this industry is full of good ideas executed by hard workers who were missing one of those four ingredients.

What the research says about chasing adjacencies

This isn’t just my read from the show floor. The business research on how companies try to grow, and how often expansion backfires, is remarkably consistent, and remarkably grim.

Bain & Company studied nearly 300 adjacency moves by retailers, meaning expansions into products, services, and markets next to the core business. Only 29% produced profitable growth. Only 15% produced significant increases in both revenue and profit. The strongest predictor of success was how close the expansion stayed to the company’s existing customers, capabilities, and cost structure.

A related Bain study published in Harvard Business Review put it even more starkly: roughly three-quarters of attempts to grow into adjacent markets fail. And the companies that did succeed at adjacency expansion had one thing in common. They already had strong core businesses before they expanded.

Then there’s the complexity problem. Research summarized in Harvard Business Review found that most businesses offer more products and services than the profit-maximizing number. Every additional offering creates operational complexity, and the cost of that complexity quietly eats into margins long before anyone notices it on a spreadsheet.
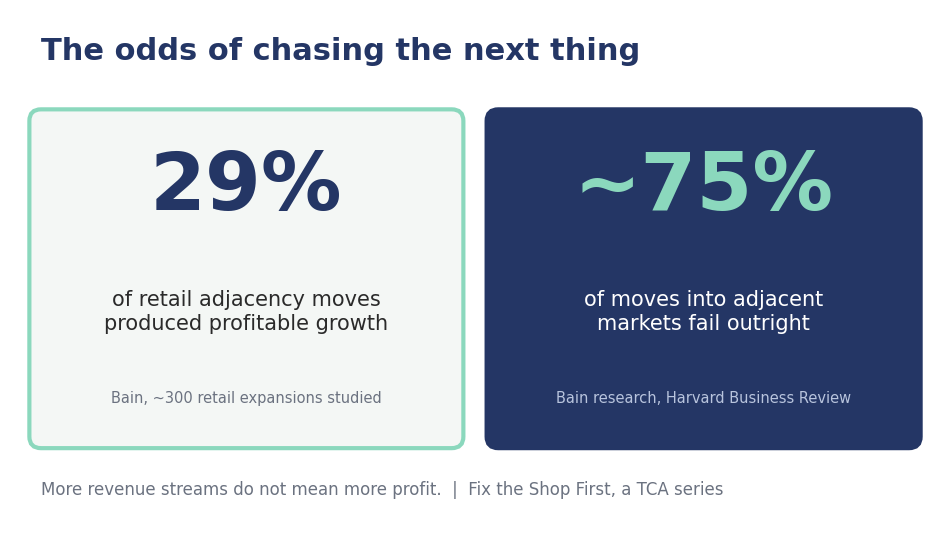
Stat graphic on why chasing adjacencies is a risky way to grow a tech repair business: only 29 percent of retail adjacency moves produced profitable growth and roughly 75 percent of adjacent market expansion attempts fail, per Bain research

Put those findings together and you get the sentence I want every shop owner to tape above the bench:

More revenue streams do not mean more profit.

A shop doing $700,000 of complicated, poorly managed business across six ventures is not healthier than a shop doing $500,000 of highly repeatable repair work at strong margins. The second owner sleeps better, banks more, and is in a far stronger position to grow a tech repair business later, on purpose, from strength.

Broaden your capability, don’t dilute your model

Now, if you’ve been reading the TCA blog for a while, you might be raising an eyebrow. Haven’t we spent the past year telling you the opposite?

We published Beyond Phone Repair, showing that your skills already transfer across ten consumer electronics categories. We published Operators in Motion, celebrating owners who grew from the bench into refurbishment, ITAD, resale, and software. We’ve covered data recovery as an expanding profit center. We stand behind every word of it.

This series is not a retraction. It’s the missing chapter.

Here’s the distinction that resolves it. A shop repairing phones, tablets, laptops, consoles, and wearables is still fundamentally running one repair business. Same skills, same workflow, same customer promise, wider funnel. That’s broadening your capability, and it’s usually smart.

A shop simultaneously trying to operate repair plus prepaid wireless plus used-device retail plus IT services plus eBay resale plus recycling plus insurance sales may be running seven mediocre businesses out of one storefront. That’s diluting your model, and it’s usually how good shops become tired shops.

Comparison graphic: one repair business covering phones, tablets, laptops, consoles, and wearables versus eight separate businesses crammed into one storefront, illustrating broadening capability versus diluting the business model

Ask the uncomfortable questions first

So before you bolt anything new onto the counter, ask yourself some uncomfortable questions. Do your customers actually want additional products and services from you, or do they want you to do more of the core repair work they already trust you with? If you sell them something they didn’t come for, can it hurt the business you already have? Do they want to deal with a salesperson or a repair person? And if you push sales too hard, does it damage the trust that drives your repair traffic in the first place? Every one of those answers decides whether you grow a tech repair business or merely complicate one.

My honest take, after two decades in this trade: people come to you for repair, and repair only. Layering sales on top of that relationship is much harder than it looks, and very few shops pull it off without eroding the thing that made customers walk in.

Every operator in motion we profiled earned the move first. Their pattern was never “chase everything.” It was master the core, systemize it, and then expand from strength into work that used the same customers, skills, and trust they’d already built. Expansion is a multiplier. Multiply a strong operation and you get growth. Multiply a broken operation and you get a bigger broken operation.

Expand only when the core has earned you the right to expand.

You can’t fix what you don’t measure

So how do you know whether your core has earned it? You measure it. Honestly, and from the outside. Nobody has ever managed to grow a tech repair business on numbers they didn’t know.

That’s exactly why the TCA built TCA ShopCheck, the free shop health check we launched at AWPE last month. In about two minutes, it scores your business across the five things that actually determine whether the core is strong: whether customers can find you, whether they choose you, whether you win the job, whether you run the operation well, and whether you’re set up to grow. It’s free, it stays free, and it exists because most owners have never had an objective look at their own shop.

Run it before you spend another hour researching that laser machine. If the score stings a little, good. That sting is the gap between the business you have and the business you could have without adding a single new venture.

And keep an eye on this space. TCA ShopCheck is the first tool in what we’re building into a full suite, with more advanced tools coming that go deeper into analyzing your operations, your numbers, and your readiness to expand. The shops that measure will always beat the shops that guess.

Find people who will pick your idea apart

One more thing before I lay out the series, because it came up in almost every one of those show-floor conversations.

The owners chasing crowded spaces and repeating past failures had something in common: everyone around them loved the idea. Their techs loved it. Their regulars loved it. Their Facebook group loved it. What they didn’t have was a single person with real authority and experience whose job was to pick the idea apart.

Your fans are great at identifying their problems and terrible at inventing your solutions. There’s a famous line, probably apocryphal, attributed to Henry Ford: if he’d asked people what they wanted, they’d have said faster horses. Customers ask for incremental versions of what already exists. Your loudest supporters don’t represent your average customer. And people will enthusiastically tell you they want something right up until you ask them to pay for it.

What you need is hard, honest feedback from people with the experience to know where the bodies are buried. People who will ask what the market demand actually is, what happened to the last three shops that tried it, and what your cash position looks like in month nine. That kind of feedback is uncomfortable, and it is worth more than a hundred likes. Part 5 of this series is entirely about where to find it and how to use it.

What’s coming in this series

Over the next several weeks, Fix the Shop First will build the complete argument, and the complete toolkit:

  1. Stop Chasing the Next Thing: Fix the Shop First (you’re reading it)
  2. The Industry With No Giants: why an industry this big has no dominant players, and what the churn rate is telling us
  3. A Good Idea and Hard Work Are Not Enough: the four ingredients that actually determine success
  4. Do You Actually Have a Profitable Repair Business?: the numbers every owner must know cold
  5. The Boring Stuff Is Where the Money Is (and Facebook Isn’t): the six figures hiding inside the shop you already own
  6. Your Fans Are Lying to You (Kindly): how to get feedback that actually protects you
  7. Everybody’s Right and Everybody’s Wrong: the silo problem, and how to vet the voices you follow
  8. When You Should Add Something New: the TCA Expansion Test
  9. Build Your Repair Machine: the TCA Core-First Growth Model

By the end, you’ll have a framework for knowing exactly when your shop has earned the right to expand, a plan for what to do until then, and a clear answer to the question every owner eventually asks: how do I grow a tech repair business without breaking the one I have?

Common questions about repair shop focus

Should a tech repair shop diversify into new revenue streams?

Only after the core repair business is consistently profitable, measured, and able to run without the owner touching everything. Research on business adjacency moves shows roughly three-quarters fail, and the successes almost always came from companies with strong core businesses first. Expansion multiplies whatever you already have, strong or broken.

Is repairing more types of devices the same as diversifying?

No. Adding tablets, laptops, consoles, and wearables to a phone repair shop broadens one repair business using the same skills, workflow, and customer trust. Diversifying means running fundamentally different businesses, like resale, IT services, recycling, and insurance, from the same storefront. The first widens your funnel. The second divides your attention.

How do I know if my repair shop is ready to grow a tech repair business beyond repair?

Start by measuring the core objectively. TCA ShopCheck is a free two-minute health check that scores your shop on getting found, getting chosen, winning the job, running well, and growing. If the core scores strong and you can answer the market demand, cash flow, timing, and team questions honestly, you’re ready to run the TCA Expansion Test coming later in this series.

Want to grow a tech repair business? The next thing can wait. The shop can’t.

If you walked one of those show floors with me this summer, you saw an industry full of energy, ideas, and ambition. That’s our strength. But energy pointed in six directions moves nothing. The owners who win over the next five years won’t be the ones with the most ideas. They’ll be the ones who built one great repair business first, measured it honestly, listened to people willing to tell them the truth, and then expanded from strength.

Next Tuesday, Part 2 asks the question hiding underneath all of this: why has an industry this large produced almost no giants? The answer lives in our brutal churn numbers, a century-old trade route working against us, and a focus problem nobody wants to name. If you’ve ever wondered why the revolving door of shops opening and closing never stops spinning, that post is for you.

Until then, run your shop through TCA ShopCheck. It takes two minutes, it’s free, and it might be the most honest conversation your business has had in years.

How healthy is your shop, really?

TCA ShopCheck is a free two-minute health check built for independent repair shops. No sales pitch, no strings. Just an honest score and a place to start.

Run TCA ShopCheck Free

More from the TCA Blog

Rob Link is the founder of the TCA. He built and ran a multi-location repair chain in an earlier era of this industry, and he’d tell you today’s operators have it harder. The TCA is independent of carriers, manufacturers, and insurance companies, which is exactly why it can tell shop owners the truth about growth.

Sources: Circana, smartphone protection purchase data (2025). Bain & Company, “Growing Beyond Your Core in Retail” (study of nearly 300 retail adjacency moves). Zook & Allen, “Growth Outside the Core,” Harvard Business Review. Gottfredson & Aspinall, “Innovation Versus Complexity: What Is Too Much of a Good Thing?”, Harvard Business Review. The TCA’s State of Tech Repair 2026 research. The Tech Care Association (TCA) is the leading nonprofit trade association for independent tech repair professionals in North America.

The Data Gap Costing Tech Repair Shops $50,000+ Per Year | TCA Blog

The Data Gap Costing Tech Repair Shops $50,000+ Per Year (And How to Close It)

Why Half the Industry Is Flying Blind—And What Industry Data Reveals About Who's Winning

If you're running a tech repair business without tracking device failure patterns, technician productivity, parts supplier quality, and customer lifetime value, you're not just missing opportunities—you're actively losing money every single day. The math is brutal: the average independent electronics repair shop leaves an estimated $50,000-$75,000 on the table annually through inefficient operations, missed upsells, dead inventory, and lost customers that generic tracking systems can't capture.

Here's the problem: less than 50% of independent tech repair shops use industry-specific point-of-sale and management systems. Even worse, many shops that have invested in platforms like Fixably, RepairShopr, RepairDesk, iQmetrix, RepairQ, or MyRepairApp fail to configure them properly to capture the data that separates profitable operations from struggling ones.

Annual Revenue Impact: Data vs. No Data No Industry-Specific System -$50K-$75K Lost opportunity annually Properly Configured System +15-50% Revenue growth potential Primary Loss Areas Without Data: Dead Inventory: $6K-$12K Pricing Errors: $15K-$40K Lost Retention: 45-60% of repeat business Supplier Quality Issues: $8K-$18K Optimized Inventory Management Data-Driven Pricing Automated Customer Retention Supplier Quality Tracking

The cost of this data gap isn't just financial—it's strategic. Without industry-wide intelligence, independent repair businesses can't benchmark performance, advocate effectively for Right to Repair legislation, negotiate group purchasing agreements, or prove their value to commercial clients and lenders. This is why the 2026 TCA State of the Tech Repair Industry Survey represents the single most important data collection effort in the North American tech repair sector.

Your Participation Isn't Charity—It's Strategic Investment

Every minute you invest in completing the industry survey returns 10-20x value through benchmark data, lending credibility, legislative advocacy, and collective purchasing power. This article explains exactly how.

The Hidden Costs of Operating Without Repair-Specific Data Systems

Walk into any thriving tech repair operation and you'll find something generic retail shops don't have: granular operational intelligence. They know which iPhone generation has the highest screen comeback rate. They know which gaming console repair is most profitable per hour of labor. They know exactly when to contact customers for preventive battery replacements based on purchase date and usage patterns. They know which parts suppliers consistently deliver quality components and which create expensive warranty issues.

Walk into most struggling shops and you'll find exceptional technicians working without this intelligence—diagnosing complex logic board failures in minutes while losing money on basic repairs because nobody's tracking the metrics that matter.

$6K-$12K
Dead inventory tying up capital in average shops
28%
Average variance between quoted and actual repair time
72%
Retention probability for customers returning within 90 days
15-50%
Revenue growth potential with proper systems

The Real Dollar Impact of Missing Data

Inventory Capital Waste: Without failure pattern tracking by device model, shops overstock parts that rarely move while constantly rush-ordering common items. Independent research shows the average shop has $6,000-$12,000 in dead or slow-moving inventory—parts for discontinued devices or low-demand repairs that tie up capital and occupy valuable shelf space. Shops using industry-specific systems with proper inventory controls reduce this waste by 40-60%.

Pricing Profit Erosion: When you don't systematically track actual repair time by device type and technician, your estimates become guesswork. Industry data from properly configured POS systems reveals that shops have an average 28% variance between quoted and actual labor time. According to the Small Business Administration's guidance on pricing strategies, accurate cost tracking is the foundation of profitable pricing. This means you're either:

  • Underpricing complex repairs and losing $15-$40 per job, or
  • Overestimating simple repairs and losing customers to competitors

Over 1,000 annual repairs, this pricing uncertainty costs $15,000-$40,000 in pure profit.

Customer Retention Blindness: Generic retail POS systems can't identify high-value customers, track device service history, or automate strategic follow-ups. Research consistently shows that acquiring new customers costs 5-25x more than retaining existing ones, yet most repair shops have no retention strategy. Research from Fixably and RepairShopr users shows that customers who return for a second repair within 90 days have a 72% probability of becoming long-term clients—but only if you have systems that identify them and trigger appropriate engagement. Without automated retention marketing, shops lose 45-60% of potential repeat business.

Real-World Example: One three-location operation documented $18,400 in annual comeback costs that disappeared when they switched to data-driven supplier selection based on tracked failure rates. They discovered their "premium" screen supplier had a 22% failure rate on a specific batch versus 3% from their "budget" alternative.

Help Shape the Future of Tech Repair

The 2026 TCA Industry Survey takes just 12-15 minutes and delivers benchmark data, lending credibility, and legislative support worth thousands to your business.

Complete the Survey Now

Why Generic POS Systems Fail Tech Repair Businesses

Square, Clover, Shopify POS, and similar retail platforms dominate small business payments—and for good reason. They're excellent at what they were designed for: fast, simple transactions. Scan item, process payment, next customer.

But tech repair isn't retail. It's a complex blend of retail, service, logistics, diagnostics, and warranty management that generic systems were never built to handle.

Generic Retail POS vs. Repair-Specific Platform Generic Retail POS ✗ No repair ticket workflows ✗ No serial/IMEI tracking ✗ No technician management ✗ No parts-to-job tracking ✗ No automated communications ✗ No device lifecycle history ✗ No diagnostic integration ✗ No warranty tracking Result: 3-5 disconnected tools Data fragmentation Operational blind spots Industry-Specific Platform ✓ Multi-stage workflow tracking ✓ Device-specific data capture ✓ Productivity & quality metrics ✓ Automated inventory deduction ✓ Customer status automation ✓ Complete repair history ✓ Test report attachment ✓ Warranty & comeback tracking Result: Unified system of record Complete operational visibility 15-50% revenue growth potential

What You Lose with Generic Systems

Critical Gaps in Retail POS for Repair Operations:

  • No Repair Ticket Workflows: Can't track where devices are in the diagnostic/repair process or who's working on them
  • No Serial Number Tracking: Can't connect devices to customer profiles, service history, or warranty status
  • No Technician Management: No visibility into productivity, quality metrics, or skill-based assignment
  • No Parts-to-Job Tracking: Can't automatically connect inventory usage to specific tickets for profitability analysis
  • No Automated Communications: Staff waste 30-45 minutes daily manually updating customers
  • No Device Lifecycle History: When customers return, you can't see previous repairs or warranty details

The result? Many shops use three to five disconnected tools: a retail POS for payments, spreadsheets for job tracking, separate inventory software, manual customer communications, and paper forms for intake documentation. This fragmentation guarantees data loss, duplicate entry, and operational blind spots.

The Repair Operating System: How Industry-Specific Platforms Transform Operations

Modern repair management platforms function as a complete operating system for device service businesses, integrating sales, service, inventory, customer relationships, and analytics into one unified system of record.

Leading platforms like RepairShopr, RepairDesk, Orderry, CellSmart POS, Fixably, iQmetrix, RepairQ, and MyRepairApp are purpose-built for the unique workflows of electronics repair, phone repair, tablet repair, laptop repair, gaming console repair, and device refurbishment operations.

The TCA Software & POS System Provider Directory receives hundreds of unique visitors monthly from shop owners researching solutions. While TCA doesn't endorse specific platforms, the directory provides comprehensive listings of industry-specific systems.

Expected Financial Returns from Proper Implementation

While individual results vary based on business size, market, and implementation quality, U.S. repair businesses that fully adopt and correctly configure industry-specific POS systems typically experience measurable improvements within 12-18 months:

15-30%
Higher average transaction value through upselling
10-20%
More completed jobs via better scheduling
5-15%
Inventory cost savings from demand-based ordering
10-40%
Increase in repeat customer rate

Taken together, shops implementing these systems properly often achieve 15-50% revenue growth over 12-18 months—not from raising prices, but from operational efficiency, reduced waste, and better customer retention.

Financial Impact Example: For a single-location shop doing $300,000 annually, this represents $45,000-$150,000 in incremental revenue. For multi-location operations, the impact multiplies across all sites.

Special Guidance for Single-Person Operations and New Shops: Start Right from Day One

If you're a solo operator or recently opened your doors, you might be thinking: "I'll worry about data systems once I'm bigger." This is the single most expensive mistake new repair businesses make.

Cost of Delaying Data System Implementation Year 1 Year 2 Year 3+ Starting Without Data Lost revenue: $28,000+ • Pricing guesswork • No customer history • Manual inefficiency • Bad habits forming Data lost forever Implementing Mid-Year Recovery cost: 6+ months • Data migration pain • Workflow retraining • Staff resistance • Lost historical data Partial recovery only Starting Day One Advantage: Maximum ✓ Accurate pricing from start ✓ Complete customer history ✓ Efficient workflows built-in ✓ Lender-ready data Foundation for growth Year 3 Growth Goal: 2nd location or expansion Banks require: 2-3 years of systematic operational data

The "Too Small for a System" Myth That Costs New Shops $30K+ in Year One

Every established shop owner who waited to implement proper data systems says the same thing: "I wish I had started with this on day one." Here's why:

Year One Pricing Mistakes Add Up Fast

Without systematic time tracking from your first repair, you're guessing at pricing. New operators consistently underprice complex work because they don't know actual labor time. One solo operator calculated he left $28,000 on the table in his first year by undercharging for logic board repairs—repairs he thought took 45 minutes but data later showed averaged 1.8 hours. You can't fix pricing you never measured.

You'll Never Rebuild Lost Historical Data: If you track customer service history from day one, you know exactly when to reach out about device upgrades, warranty expirations, and preventive maintenance. Wait until year two to implement tracking and you've lost 12 months of revenue opportunities. Those first 200 customers could have generated $12,000-$18,000 in repeat business over years 2-5—but only if you captured their device information and service dates from the start.

Banks Want to See Systems When You're Ready to Grow: Planning to open a second location in year three? Need equipment financing? Lenders want to see 2-3 years of systematically tracked financial and operational data. If you've been running on spreadsheets and memory, you'll spend 6+ months retroactively trying to document performance—and probably won't have the data quality lenders require.

Good Habits Are Easier to Build Than Bad Ones to Break: Starting with paper tickets and manual tracking creates workflow habits that become incredibly hard to change later. You and any future employees learn inefficient processes. Start digital from day one and efficiency is your baseline, not a future goal.

What "Starting Right" Looks Like for a Solo Operator

Month 1: Choose Your Platform

Even as a one-person shop, you need an industry-specific system. Many platforms have solo operator pricing starting at $50-$80/month—less than the value of one underpriced repair per month.

Visit the TCA Software & POS Provider Directory and filter for solutions designed for single-location, small operations. Software providers can enhance their directory presence for greater visibility starting at $100/year (Premium Supplier Listing) or join as full Industry Partners (Industry Partnership) for comprehensive member benefits.

Essential Features for New Shops:

  • Cloud-based systems (no server to maintain)
  • Mobile-friendly interfaces (repair from your phone)
  • Simple implementation (up and running in days, not months)
  • Automated customer communications (eliminates your communication burden)
  • Basic inventory tracking (even with 50 SKUs, you need this)

Month 1-2: Configure Essentials Only

Don't get overwhelmed with every feature. Configure these five things first:

  1. Digital intake form capturing device IMEI, customer contact, and photo documentation
  2. Automated status notifications for "received," "diagnosed," "ready for pickup"
  3. Time tracking for every repair (even if you're the only tech)
  4. Basic inventory for your 20-30 most common parts
  5. Payment processing integrated with your accounting software

That's it. You can add advanced features later—but these five capture the data that makes or breaks a new business.

The Solo Operator Advantage: Perfect Implementation

Large shops struggle to change established behaviors across 5-10 employees. You have an advantage: you only need to train one person—yourself.

Build perfect data discipline from day one. These habits take 30 days to cement. By month two, they're automatic. By year two, you have data quality that shops operating for a decade don't have—because they never built the discipline early.

Why New Shops Should Join TCA and Complete the Survey Immediately

The annual survey data becomes exponentially more valuable when you participate from the beginning. After six months, complete the 2026 TCA Industry Survey. You'll see:

  • How your first-year performance compares to industry norms
  • What successful shops achieved in year one (realistic benchmarks)
  • Which early investments delivered the best returns
  • What mistakes to avoid that tanked other startups

First-year membership in TCA costs less than one equipment purchase—and the intelligence gained from benchmarking data and peer connections typically delivers 10-20x ROI in avoided mistakes and optimized decisions.

Resources specifically for new operations are available through the U.S. Small Business Administration, but TCA provides repair-specific guidance including startup playbooks, pricing models, marketing templates, and peer mentorship with established operators.

Start Your Data Journey Today

Whether you're a 10-year veteran or opening next week, the 2026 Industry Survey provides the benchmark intelligence you need to compete successfully.

Complete the 2026 TCA Survey

Industry-Wide Data: The Strategic Asset Generic Systems Can't Provide

Individual shop data optimizes your business. Industry-wide data transforms the competitive landscape for every independent repair operation.

This is where trade associations move beyond networking and become strategic assets. The Tech Care Association isn't just a membership organization—it's the primary source of statistically valid, comprehensive intelligence about the independent tech repair, refurbishment, and reuse industries in North America.

Three Layers of Data Intelligence Layer 1: Internal Operational Data Which repairs are profitable • Supplier quality • Customer value Your own historical performance benchmarks Layer 2: Industry Benchmark Data Performance vs. successful peers • Market rates • Best-in-class metrics TCA Industry Survey provides this layer Layer 3: Strategic Trend Intelligence Emerging services • Technology shifts • Industry challenges Future opportunities and threats Makes you EFFICIENT Makes you COMPETITIVE Makes you ANTIFRAGILE

What Makes TCA's Industry Research Different (And Why It Matters to Your Bottom Line)

The electronics repair industry suffers from a credibility problem. Manufacturers and authorized service networks claim independent shops are unprofessional, unqualified, and unreliable. Individual shops can't effectively counter these narratives—but rigorous, association-level data can.

TCA is the only organization conducting academic-grade research with proper sampling methodology and statistical validation on the tech repair sector. This credibility creates tangible business value for every participating shop through legislative advocacy, lending support, commercial contracting, and collective purchasing agreements.

How the 2026 State of the Industry Survey Directly Impacts Your Business

Completing the 2026 TCA State of the Tech Repair Industry Survey takes 12-15 minutes. That modest time investment delivers multiple returns:

1. Performance Benchmarking You Can't Get Anywhere Else

Once results are published, you'll see exactly where your operation stands on industry metrics including labor rates, parts markup, technician productivity, service mix, and customer acquisition costs. This isn't generic small business advice—it's actionable intelligence specific to electronics repair economics.

Real-World Example: A Denver shop discovered through TCA benchmarking data that their labor rate was $18/hour below market average for their metro area. They raised rates by 12% and lost exactly zero customers while adding $47,000 to annual revenue.

2. Credibility That Wins Commercial Contracts and Insurance Partnerships

When bidding against manufacturer-authorized service centers for corporate repair contracts, insurance referral partnerships, or government procurement opportunities, you need proof that independent shops deliver quality service. Published TCA research provides data-backed evidence of faster turnaround times, competitive comeback rates, broader device coverage, and transparent pricing.

Several TCA members have reported landing $50,000-$200,000 annual contracts specifically because they included TCA industry data in their bid proposals.

3. Lending and Growth Capital Access

Banks and SBA lenders want evidence you understand your market, proof you operate at or above industry standards, and data showing growth potential. TCA's published benchmarks dramatically strengthen loan applications.

Real-World Example: A three-location operator seeking $250,000 expansion financing included TCA survey data showing: (a) the tech repair industry was growing at 8-12% annually, (b) their per-location revenue exceeded industry median by 34%, and (c) their technician productivity ranked in the top 20%. The data helped secure favorable terms the banker later admitted they wouldn't have offered without industry context.

4. Legislative Advocacy That Protects Your Business Model

Right to Repair legislation is advancing across North America (learn more at Repair.org), but success depends on proving to lawmakers that manufacturers are systematically restricting independent repair access. TCA uses survey data to document diagnostic software blocks, parts availability restrictions, economic impact, and consumer harm.

Without hard numbers, legislators dismiss these concerns as anecdotal complaints. Your survey response literally becomes evidence in legislative testimony and policy briefings.

Real-World Impact: TCA's 2024 survey data showing 78% of independent shops faced parts availability restrictions was cited in four state legislative hearings and three federal policy briefings. Two states subsequently passed right-to-repair bills with specific provisions addressing parts access—directly impacting shop viability.

5. Strategic Intelligence for Business Planning

The survey captures forward-looking trends that individual shops can't see: which repair types are seeing growth, how many shops are implementing AI diagnostics or device buyback programs, what obstacles most concern operators, where successful shops are allocating capital, and how market conditions differ between metropolitan, suburban, and rural areas.

Real-World Example: Survey data revealed gaming console repairs grew 41% year-over-year in 2024-2025, while tablet repairs declined 12%. Shops that pivoted marketing and training toward gaming repair saw significant revenue growth, while those focused on declining categories struggled.

6. Collective Purchasing Power and Vendor Negotiations

TCA negotiates group purchasing agreements, insurance programs, and supplier partnerships on behalf of the 1,700+ member network. The leverage in these negotiations comes directly from documented aggregate purchase volumes and needs captured in member surveys.

Real-World Savings: TCA negotiated a 15% discount on general liability insurance through a group program informed by survey data. Members save $600-$2,400 annually—far exceeding the time cost of survey participation.

Your 12 Minutes Shapes an Entire Year

The 2026 survey closes soon. Your participation creates the benchmark data, legislative evidence, and collective bargaining power that benefits every independent repair shop.

Complete the Survey Now

Why This Survey Matters More Than Any Previous Year

The 2026 tech repair landscape is experiencing unprecedented change:

Critical Industry Shifts Requiring Current Data:

  • AI-Powered Diagnostics are changing workflow speed and accuracy, but adoption rates and ROI are still unknown
  • Right to Repair Momentum is building legislatively (learn more at Repair.org), but success depends on documented evidence of manufacturer restrictions
  • Manufacturer Lockdown Escalation including software pairing requirements and activation locks is intensifying
  • Device Lifecycle Business Models are shifting toward subscription and manufacturer trade-in programs
  • Parts Supply Chain Disruptions continue creating availability and cost challenges
  • Technician Shortage is constraining growth for shops that can't compete with tech sector wages
  • Refurbishment Market Explosion is creating opportunities but requires infrastructure most shops lack

Every one of these trends directly affects your bottom line—and TCA's ability to respond effectively through advocacy, resources, and collective action depends entirely on having current, comprehensive industry data. Last year's numbers don't capture this year's reality.

The TCA Advantage: Free Resources for Every Repair Professional

The Tech Care Association exists to elevate the entire independent tech repair industry through comprehensive support:

The Bottom Line: Data Creates Competitive Moats

The era of competing on technical skill alone ended years ago. The repair shop that thrives in 2026 and beyond operates on three layers of intelligence:

Layer 1: Internal Operational Data — Knowing precisely which repairs are most profitable, which suppliers deliver consistent quality, which customers are most valuable, and how performance compares to your own historical benchmarks

Layer 2: Industry Benchmark Data — Understanding where you stand relative to successful peers, what market rates look like in your region, and what best-in-class operators are achieving

Layer 3: Strategic Trend Data — Seeing which service categories are growing, which technologies are emerging, where industry challenges are intensifying, and what opportunities are developing

Individual shop data makes you efficient.
Industry-wide data makes you competitive.
Strategic trend intelligence makes you antifragile.

Shape the Future of Tech Repair

Complete the 2026 TCA State of the Tech Repair Industry Survey today. Your 12-15 minutes shapes an entire industry's next year—and positions your business to benefit from the collective intelligence that emerges.

Complete the 2026 Survey

Your voice matters. Your data matters. Your business deserves the strategic advantage that comes from being part of something larger than any single shop can achieve alone.